
Page 432 - Applied Statistics with R
P. 432
432 CHAPTER 17. LOGISTIC REGRESSION
where = − , the difference in number of parameters of the two models.
This test, which we will call the Likelihood-Ratio Test, will be the ana-
logue to the ANOVA -test for logistic regression. Interestingly, to perform the
Likelihood-Ratio Test, we’ll actually again use the anova() function in R!.
The Likelihood-Ratio Test is actually a rather general test, however, here we
have presented a specific application to nested logistic regression models.
17.3.4 SAheart Example
To illustrate the use of logistic regression, we will use the SAheart dataset from
the ElemStatLearn package.
# install.packages("bestglm")
library(bestglm)
## Loading required package: leaps
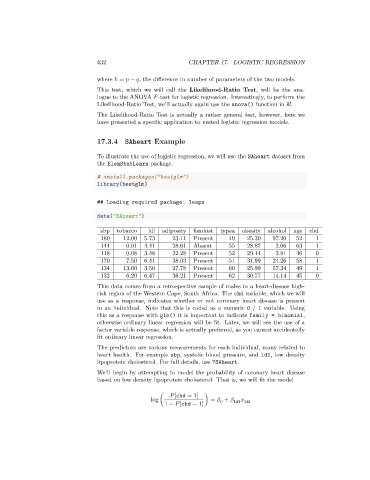
data("SAheart")
sbp tobacco ldl adiposity famhist typea obesity alcohol age chd
160 12.00 5.73 23.11 Present 49 25.30 97.20 52 1
144 0.01 4.41 28.61 Absent 55 28.87 2.06 63 1
118 0.08 3.48 32.28 Present 52 29.14 3.81 46 0
170 7.50 6.41 38.03 Present 51 31.99 24.26 58 1
134 13.60 3.50 27.78 Present 60 25.99 57.34 49 1
132 6.20 6.47 36.21 Present 62 30.77 14.14 45 0
This data comes from a retrospective sample of males in a heart-disease high-
risk region of the Western Cape, South Africa. The chd variable, which we will
use as a response, indicates whether or not coronary heart disease is present
in an individual. Note that this is coded as a numeric 0 / 1 variable. Using
this as a response with glm() it is important to indicate family = binomial,
otherwise ordinary linear regression will be fit. Later, we will see the use of a
factor variable response, which is actually preferred, as you cannot accidentally
fit ordinary linear regression.
The predictors are various measurements for each individual, many related to
heart health. For example sbp, systolic blood pressure, and ldl, low density
lipoprotein cholesterol. For full details, use ?SAheart.
We’ll begin by attempting to model the probability of coronary heart disease
based on low density lipoprotein cholesterol. That is, we will fit the model
[chd = 1]
log ( ) = +
1 − [chd = 1] 0 ldl ldl