
Page 148 - APPLIED PROCESS DESIGN FOR CHEMICAL AND PETROCHEMICAL PLANTS, Volume 1, 3rd Edition
P. 148
132 Applied Process Design for Chemical and Petrochemical Plants
ABSOLtrrE VISCOSITI' X ICY· POUNDS PER l'OOT-SECOND
5.00
4.00 I\
3.00
' \
2.00
'
� I 12 AND 18 INCH PfPE I I\
1.00
8:'8
0.60 \
0.50 '
0.40 r-..
' ... \
'- '\. 6 AND I INCH PIPE � - I\ \
" ' \
1,
0.10 "� r\
0.01 -
0.07 '
0.06
0.05 \
0.04 \.
0.03
:\.
" '
0.02
'\
o.o I '\
.
40 5060 80100 200 300 500 1000 2000
D,,p I'\.
REYNOLDS NUMBER Ro = - 0
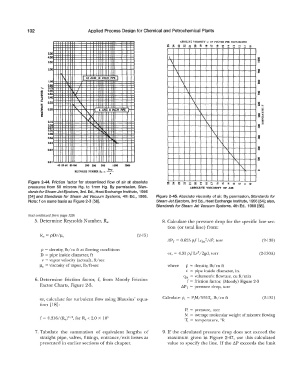
Figure 2-44. Friction factor for streamlined flow of air at absolute
pressures from 50 microns Hg. to 1 mm Hg. By permission, Stan- ABSOurrE VISCOSITY OF AIR
dards for Steam Jet Ejectors, 3rd. Ed., Heat Exchange Institute, 1956
[54] and Standards for Steam Jet Vacuum Systems, 4th Ed., 1988. Figure 2-45. Absolute viscosity of air. By permission, Standards for
Note: f on same basis as Figure 2-3 [58]. Steam Jet Ejectors, 3rd Ed., Heat Exchange Institute, 1956 (54]; also,
Standards for Steam Jet Vacuum Systems, 4th Ed., 1988 [58].
(text continued from page 129)
5. Determine Reynolds Number, R,,. 8. Calculate the pressure drop for the specific line sec-
tion ( or total line) from:
(2-15)
(2-130)
p = density, lb/ cu ft at flowing conditions
2
D = pipe inside diameter, ft or, = 4.31 p.f Lv /2gd, Lorr (2-l 30A)
v = vapor velocity (actual), ft/sec
µ 0 = viscosity of vapor, lb/ft-sec where p = density, lb/cu ft
d = pipe inside diameter, in.
qm = volumetric flowrate, cu ft/min
6. Determine friction factor, f, from Moody Friction f = friction factor, (Moody) Figure 2-3
Factor Charts, Figure 2-3. .1.PT = pressure drop, torr
or, calculate for turbulent flow using Blausius' equa- Calculate: P; = P;M/555Ti, lb/cu ft (2-131)
tion [18]:
P; = pressure, torr
M = average molecular weight of mixture flowing
1
f = 0.316/ (R,,) 11, for R,, < 2.0 X 10 5
T; = temperature, R
0
7. Tabulate the summation of equivalent lengths of 9. If the calculated pressure drop does not exceed the
straight pipe, valves, fittings, entrance/exit losses as maximum given in Figure 2-47, use this calculated
presented in earlier sections of this chapter. value to specify the line. If the �p exceeds the limit