Page 566 - APPLIED PROCESS DESIGN FOR CHEMICAL AND PETROCHEMICAL PLANTS, Volume 1, 3rd Edition
P. 566

532                       Applied Process Design for Chemical  and Petrochemical  Plants

                    1.0
                                            ...--                 :r Ax
                                        �                           L
                    0.9             v
                               /


                    0.8       v
                        \I

                    0.7
                        'I
               i    0.6


                0         \
               ::j'
               "s..   0.5
               s            \
               lo-I
                0             \
               i    0.4
               a:              ""�                               Flame geometry
                                                                    in still air
                     0.3              <,                         and  lateral wind
                                            r-,

                    0.2


                     0.1


                      0
                             0.1    0.2    0.3   0.4    0.5    0.6    0.7    0.8   0.9    1.0   1.1    1.2    1.3
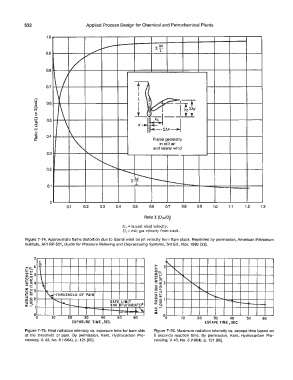
                                                             Ratio :r (Uco/Uj)
                                                    U� = lateral wind velocity.
                                                     U1  = exit gas velocity from stack.

            Figure 7-74.  Approximate flame distortion  due to lateral  wind on jet velocity from flare  stack.  Reprinted  by permission, American  Petroleum
            Institute,  API  RP-521, Guide  for Pressure Relieving and Depressuring Systems,  3rd  Ed.,  Nov.  1990  [33].


               7
                 b                                                     <,
                                                                         "'-...
                  \                                                           -,
                   '                                                                <;

                    I�  ._.THRESHOLD  OF  PAIN                                    """  'r-,  �
                        ..............         SAFE  LIMIT                                      - -
                           I'-.  --            440  BTU/(HR.l(Ft)2
                                                          I
                                                  I  I  I   l -�
                       10    20     30     40     50     60                  10    20     30     40     50     60
                               EXPOSURE  TIME ,SEC.                                   ESCAPE  TIME,  SEC.
           Figure 7-75.  Heat radiation  intensity vs. exposure time for bare skin   Figure 7-76.  Maximum radiation intensity vs.  escape time based on
           at  the  threshold  of  pain.  By  permission,  Kent,  Hydrocarbon  Pro-   5  seconds  reaction  time.  By  permission,  Kent,  Hydrocarbon  Pro-
           cessing,  V.  43,  No.  8 (1964),  p. 121  (60].      cessing,  V.  43,  No.  8 (1964), p. 121  (60].
   561   562   563   564   565   566   567   568   569   570   571