
Page 157 - Python Data Science Handbook
P. 157
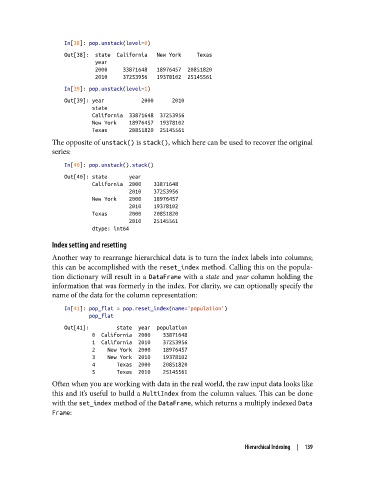
In[38]: pop.unstack(level=0)
                   Out[38]:  state  California   New York     Texas
                             year
                             2000     33871648   18976457  20851820
                             2010     37253956   19378102  25145561
                   In[39]: pop.unstack(level=1)
                   Out[39]: year            2000      2010
                            state
                            California  33871648  37253956
                            New York    18976457  19378102
                            Texas       20851820  25145561
               The opposite of unstack() is stack(), which here can be used to recover the original
               series:

                   In[40]: pop.unstack().stack()
                   Out[40]: state       year
                            California  2000    33871648
                                        2010    37253956
                            New York    2000    18976457
                                        2010    19378102
                            Texas       2000    20851820
                                        2010    25145561
                            dtype: int64
               Index setting and resetting

               Another way to rearrange hierarchical data is to turn the index labels into columns;
               this can be accomplished with the reset_index method. Calling this on the popula‐
               tion dictionary will result in a DataFrame  with a state  and year  column holding the
               information that was formerly in the index. For clarity, we can optionally specify the
               name of the data for the column representation:

                   In[41]: pop_flat = pop.reset_index(name='population')
                           pop_flat
                   Out[41]:         state  year  population
                            0  California  2000    33871648
                            1  California  2010    37253956
                            2    New York  2000    18976457
                            3    New York  2010    19378102
                            4       Texas  2000    20851820
                            5       Texas  2010    25145561
               Often when you are working with data in the real world, the raw input data looks like
               this and it’s useful to build a MultiIndex from the column values. This can be done
               with the set_index method of the DataFrame, which returns a multiply indexed Data
               Frame:


                                                                     Hierarchical Indexing  |  139