
Page 158 - Python Data Science Handbook
P. 158
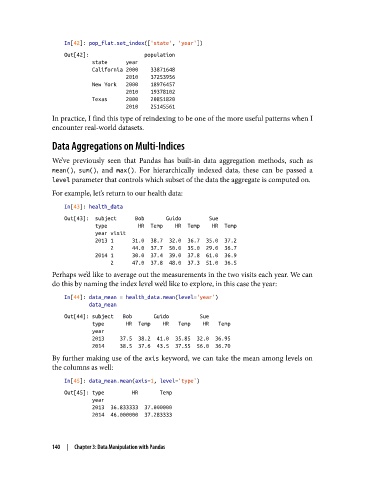
In[42]: pop_flat.set_index(['state', 'year'])
                   Out[42]:                  population
                            state      year
                            California 2000    33871648
                                       2010    37253956
                            New York   2000    18976457
                                       2010    19378102
                            Texas      2000    20851820
                                       2010    25145561
               In practice, I find this type of reindexing to be one of the more useful patterns when I
               encounter real-world datasets.

               Data Aggregations on Multi-Indices

               We’ve previously seen that Pandas has built-in data aggregation methods, such as
               mean(), sum(), and max(). For hierarchically indexed data, these can be passed a
               level parameter that controls which subset of the data the aggregate is computed on.
               For example, let’s return to our health data:

                   In[43]: health_data
                   Out[43]:  subject      Bob       Guido         Sue
                             type          HR  Temp    HR  Temp    HR  Temp
                             year visit
                             2013 1      31.0  38.7  32.0  36.7  35.0  37.2
                                  2      44.0  37.7  50.0  35.0  29.0  36.7
                             2014 1      30.0  37.4  39.0  37.8  61.0  36.9
                                  2      47.0  37.8  48.0  37.3  51.0  36.5
               Perhaps we’d like to average out the measurements in the two visits each year. We can
               do this by naming the index level we’d like to explore, in this case the year:

                   In[44]: data_mean = health_data.mean(level='year')
                           data_mean
                   Out[44]: subject   Bob       Guido          Sue
                            type       HR  Temp    HR   Temp    HR   Temp
                            year
                            2013     37.5  38.2  41.0  35.85  32.0  36.95
                            2014     38.5  37.6  43.5  37.55  56.0  36.70
               By further making use of the axis keyword, we can take the mean among levels on
               the columns as well:

                   In[45]: data_mean.mean(axis=1, level='type')
                   Out[45]: type         HR       Temp
                            year
                            2013  36.833333  37.000000
                            2014  46.000000  37.283333


               140  |  Chapter 3: Data Manipulation with Pandas