
Page 177 - Python Data Science Handbook
P. 177
explore aggregations in Pandas, from simple operations akin to what we’ve seen on
NumPy arrays, to more sophisticated operations based on the concept of a groupby.
Planets Data
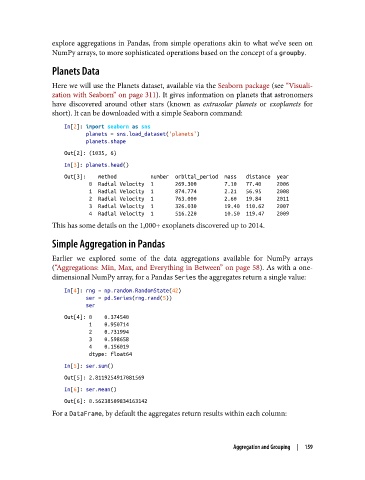
Here we will use the Planets dataset, available via the Seaborn package (see “Visuali‐
zation with Seaborn” on page 311). It gives information on planets that astronomers
have discovered around other stars (known as extrasolar planets or exoplanets for
short). It can be downloaded with a simple Seaborn command:
In[2]: import seaborn as sns
planets = sns.load_dataset('planets')
planets.shape
Out[2]: (1035, 6)
In[3]: planets.head()
Out[3]: method number orbital_period mass distance year
0 Radial Velocity 1 269.300 7.10 77.40 2006
1 Radial Velocity 1 874.774 2.21 56.95 2008
2 Radial Velocity 1 763.000 2.60 19.84 2011
3 Radial Velocity 1 326.030 19.40 110.62 2007
4 Radial Velocity 1 516.220 10.50 119.47 2009
This has some details on the 1,000+ exoplanets discovered up to 2014.
Simple Aggregation in Pandas
Earlier we explored some of the data aggregations available for NumPy arrays
(“Aggregations: Min, Max, and Everything in Between” on page 58). As with a one-
dimensional NumPy array, for a Pandas Series the aggregates return a single value:
In[4]: rng = np.random.RandomState(42)
ser = pd.Series(rng.rand(5))
ser
Out[4]: 0 0.374540
1 0.950714
2 0.731994
3 0.598658
4 0.156019
dtype: float64
In[5]: ser.sum()
Out[5]: 2.8119254917081569
In[6]: ser.mean()
Out[6]: 0.56238509834163142
For a DataFrame, by default the aggregates return results within each column:
Aggregation and Grouping | 159