
Page 194 - Python Data Science Handbook
P. 194
Next we set the day column to integers; previously it had been a string because some
columns in the dataset contained the value 'null':
In[17]: # set 'day' column to integer; it originally was a string due to nulls
births['day'] = births['day'].astype(int)
Finally, we can combine the day, month, and year to create a Date index (see “Work‐
ing with Time Series” on page 188). This allows us to quickly compute the weekday
corresponding to each row:
In[18]: # create a datetime index from the year, month, day
births.index = pd.to_datetime(10000 * births.year +
100 * births.month +
births.day, format='%Y%m%d')
births['dayofweek'] = births.index.dayofweek
Using this we can plot births by weekday for several decades (Figure 3-3):
In[19]:
import matplotlib.pyplot as plt
import matplotlib as mpl
births.pivot_table('births', index='dayofweek',
columns='decade', aggfunc='mean').plot()
plt.gca().set_xticklabels(['Mon', 'Tues', 'Wed', 'Thurs', 'Fri', 'Sat', 'Sun'])
plt.ylabel('mean births by day');
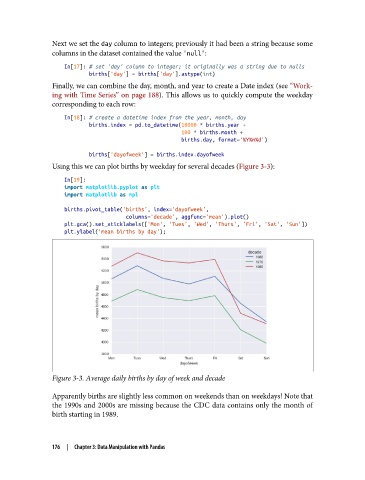
Figure 3-3. Average daily births by day of week and decade
Apparently births are slightly less common on weekends than on weekdays! Note that
the 1990s and 2000s are missing because the CDC data contains only the month of
birth starting in 1989.
176 | Chapter 3: Data Manipulation with Pandas