
Page 245 - Python Data Science Handbook
P. 245
If no color is specified, Matplotlib will automatically cycle through a set of default
colors for multiple lines.
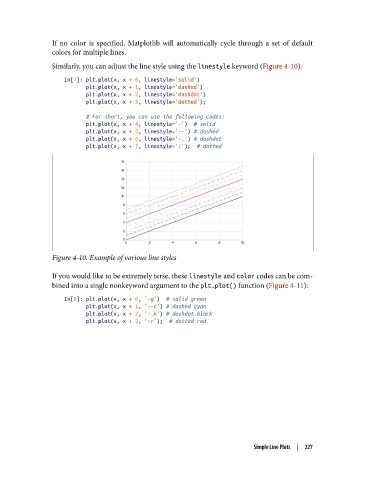
Similarly, you can adjust the line style using the linestyle keyword (Figure 4-10):
In[7]: plt.plot(x, x + 0, linestyle='solid')
plt.plot(x, x + 1, linestyle='dashed')
plt.plot(x, x + 2, linestyle='dashdot')
plt.plot(x, x + 3, linestyle='dotted');
# For short, you can use the following codes:
plt.plot(x, x + 4, linestyle='-') # solid
plt.plot(x, x + 5, linestyle='--') # dashed
plt.plot(x, x + 6, linestyle='-.') # dashdot
plt.plot(x, x + 7, linestyle=':'); # dotted
Figure 4-10. Example of various line styles
If you would like to be extremely terse, these linestyle and color codes can be com‐
bined into a single nonkeyword argument to the plt.plot() function (Figure 4-11):
In[8]: plt.plot(x, x + 0, '-g') # solid green
plt.plot(x, x + 1, '--c') # dashed cyan
plt.plot(x, x + 2, '-.k') # dashdot black
plt.plot(x, x + 3, ':r'); # dotted red
Simple Line Plots | 227