
Page 289 - Python Data Science Handbook
P. 289
Any graphics display framework needs some scheme for translating between coordi‐
nate systems. For example, a data point at x, y = 1, 1 needs to somehow be repre‐
sented at a certain location on the figure, which in turn needs to be represented in
pixels on the screen. Mathematically, such coordinate transformations are relatively
straightforward, and Matplotlib has a well-developed set of tools that it uses inter‐
nally to perform them (the tools can be explored in the matplotlib.transforms sub‐
module).
The average user rarely needs to worry about the details of these transforms, but it is
helpful knowledge to have when considering the placement of text on a figure. There
are three predefined transforms that can be useful in this situation:
ax.transData
Transform associated with data coordinates
ax.transAxes
Transform associated with the axes (in units of axes dimensions)
fig.transFigure
Transform associated with the figure (in units of figure dimensions)
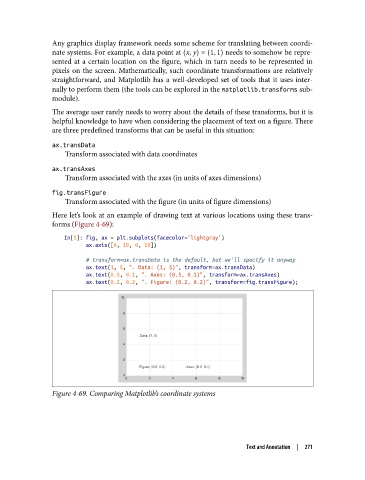
Here let’s look at an example of drawing text at various locations using these trans‐
forms (Figure 4-69):
In[5]: fig, ax = plt.subplots(facecolor='lightgray')
ax.axis([0, 10, 0, 10])
# transform=ax.transData is the default, but we'll specify it anyway
ax.text(1, 5, ". Data: (1, 5)", transform=ax.transData)
ax.text(0.5, 0.1, ". Axes: (0.5, 0.1)", transform=ax.transAxes)
ax.text(0.2, 0.2, ". Figure: (0.2, 0.2)", transform=fig.transFigure);
Figure 4-69. Comparing Matplotlib’s coordinate systems
Text and Annotation | 271