
Page 290 - Python Data Science Handbook
P. 290
Note that by default, the text is aligned above and to the left of the specified coordi‐
nates; here the “.” at the beginning of each string will approximately mark the given
coordinate location.
The transData coordinates give the usual data coordinates associated with the x- and
y-axis labels. The transAxes coordinates give the location from the bottom-left cor‐
ner of the axes (here the white box) as a fraction of the axes size. The transFigure
coordinates are similar, but specify the position from the bottom left of the figure
(here the gray box) as a fraction of the figure size.
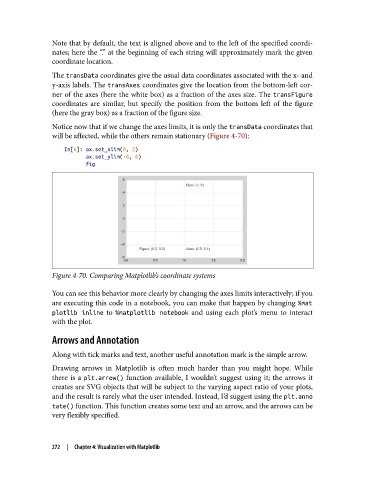
Notice now that if we change the axes limits, it is only the transData coordinates that
will be affected, while the others remain stationary (Figure 4-70):
In[6]: ax.set_xlim(0, 2)
ax.set_ylim(-6, 6)
fig
Figure 4-70. Comparing Matplotlib’s coordinate systems
You can see this behavior more clearly by changing the axes limits interactively; if you
are executing this code in a notebook, you can make that happen by changing %mat
plotlib inline to %matplotlib notebook and using each plot’s menu to interact
with the plot.
Arrows and Annotation
Along with tick marks and text, another useful annotation mark is the simple arrow.
Drawing arrows in Matplotlib is often much harder than you might hope. While
there is a plt.arrow() function available, I wouldn’t suggest using it; the arrows it
creates are SVG objects that will be subject to the varying aspect ratio of your plots,
and the result is rarely what the user intended. Instead, I’d suggest using the plt.anno
tate() function. This function creates some text and an arrow, and the arrows can be
very flexibly specified.
272 | Chapter 4: Visualization with Matplotlib