
Page 284 - Python Data Science Handbook
P. 284
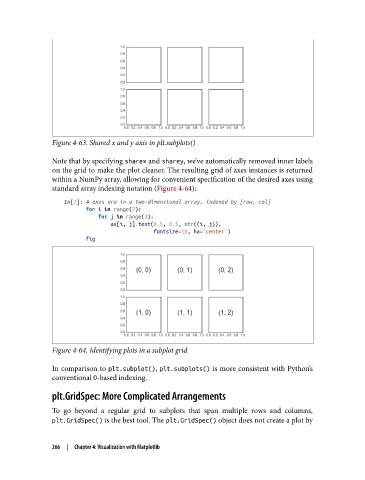
Figure 4-63. Shared x and y axis in plt.subplots()

               Note that by specifying sharex and sharey, we’ve automatically removed inner labels
               on the grid to make the plot cleaner. The resulting grid of axes instances is returned
               within a NumPy array, allowing for convenient specification of the desired axes using
               standard array indexing notation (Figure 4-64):
                   In[7]: # axes are in a two-dimensional array, indexed by [row, col]
                          for i in range(2):
                              for j in range(3):
                                  ax[i, j].text(0.5, 0.5, str((i, j)),
                                                fontsize=18, ha='center')
                          fig


               Figure 4-64. Identifying plots in a subplot grid


               In comparison to plt.subplot(), plt.subplots() is more consistent with Python’s
               conventional 0-based indexing.

               plt.GridSpec: More Complicated Arrangements

               To go beyond a regular grid to subplots that span multiple rows and columns,
               plt.GridSpec() is the best tool. The plt.GridSpec() object does not create a plot by


               266  |  Chapter 4: Visualization with Matplotlib