
Page 295 - Python Data Science Handbook
P. 295
We’ll now show a few examples of setting these locators and formatters for various
plots.
Hiding Ticks or Labels
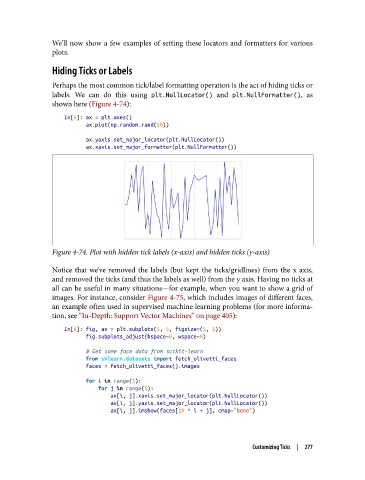
Perhaps the most common tick/label formatting operation is the act of hiding ticks or
labels. We can do this using plt.NullLocator() and plt.NullFormatter(), as
shown here (Figure 4-74):
In[5]: ax = plt.axes()
ax.plot(np.random.rand(50))
ax.yaxis.set_major_locator(plt.NullLocator())
ax.xaxis.set_major_formatter(plt.NullFormatter())
Figure 4-74. Plot with hidden tick labels (x-axis) and hidden ticks (y-axis)
Notice that we’ve removed the labels (but kept the ticks/gridlines) from the x axis,
and removed the ticks (and thus the labels as well) from the y axis. Having no ticks at
all can be useful in many situations—for example, when you want to show a grid of
images. For instance, consider Figure 4-75, which includes images of different faces,
an example often used in supervised machine learning problems (for more informa‐
tion, see “In-Depth: Support Vector Machines” on page 405):
In[6]: fig, ax = plt.subplots(5, 5, figsize=(5, 5))
fig.subplots_adjust(hspace=0, wspace=0)
# Get some face data from scikit-learn
from sklearn.datasets import fetch_olivetti_faces
faces = fetch_olivetti_faces().images
for i in range(5):
for j in range(5):
ax[i, j].xaxis.set_major_locator(plt.NullLocator())
ax[i, j].yaxis.set_major_locator(plt.NullLocator())
ax[i, j].imshow(faces[10 * i + j], cmap="bone")
Customizing Ticks | 277