
Page 299 - Python Data Science Handbook
P. 299
elif N == 1:
return r"$\pi/2$"
elif N == 2:
return r"$\pi$"
elif N % 2 > 0:
return r"${0}\pi/2$".format(N)
else:
return r"${0}\pi$".format(N // 2)
ax.xaxis.set_major_formatter(plt.FuncFormatter(format_func))
fig
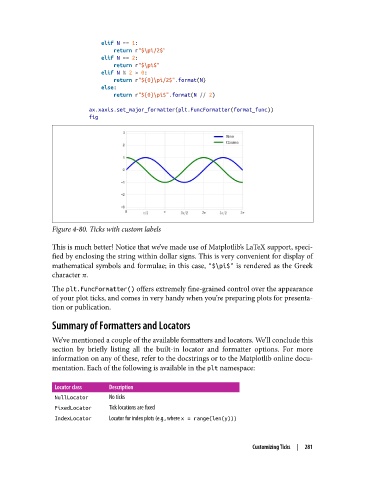
Figure 4-80. Ticks with custom labels
This is much better! Notice that we’ve made use of Matplotlib’s LaTeX support, speci‐
fied by enclosing the string within dollar signs. This is very convenient for display of
mathematical symbols and formulae; in this case, "$\pi$" is rendered as the Greek
character π.
The plt.FuncFormatter() offers extremely fine-grained control over the appearance
of your plot ticks, and comes in very handy when you’re preparing plots for presenta‐
tion or publication.
Summary of Formatters and Locators
We’ve mentioned a couple of the available formatters and locators. We’ll conclude this
section by briefly listing all the built-in locator and formatter options. For more
information on any of these, refer to the docstrings or to the Matplotlib online docu‐
mentation. Each of the following is available in the plt namespace:
Locator class Description
NullLocator No ticks
FixedLocator Tick locations are xed
IndexLocator Locator for index plots (e.g., where x = range(len(y)))
Customizing Ticks | 281