
Page 298 - Python Data Science Handbook
P. 298
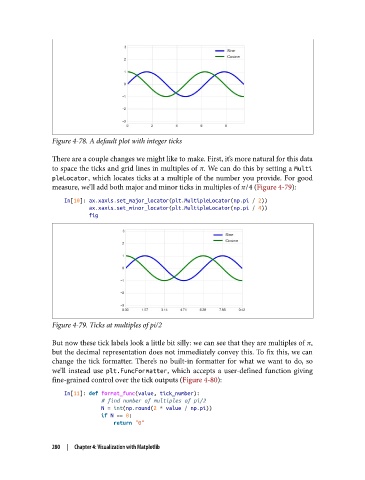
Figure 4-78. A default plot with integer ticks

               There are a couple changes we might like to make. First, it’s more natural for this data
               to space the ticks and grid lines in multiples of π. We can do this by setting a Multi
               pleLocator, which locates ticks at a multiple of the number you provide. For good
               measure, we’ll add both major and minor ticks in multiples of π/4 (Figure 4-79):

                   In[10]: ax.xaxis.set_major_locator(plt.MultipleLocator(np.pi / 2))
                           ax.xaxis.set_minor_locator(plt.MultipleLocator(np.pi / 4))
                           fig


               Figure 4-79. Ticks at multiples of pi/2

               But now these tick labels look a little bit silly: we can see that they are multiples of π,
               but the decimal representation does not immediately convey this. To fix this, we can
               change the tick formatter. There’s no built-in formatter for what we want to do, so
               we’ll instead use plt.FuncFormatter, which accepts a user-defined function giving
               fine-grained control over the tick outputs (Figure 4-80):

                   In[11]: def format_func(value, tick_number):
                               # find number of multiples of pi/2
                               N = int(np.round(2 * value / np.pi))
                               if N == 0:
                                   return "0"


               280  |  Chapter 4: Visualization with Matplotlib