
Page 317 - Python Data Science Handbook
P. 317
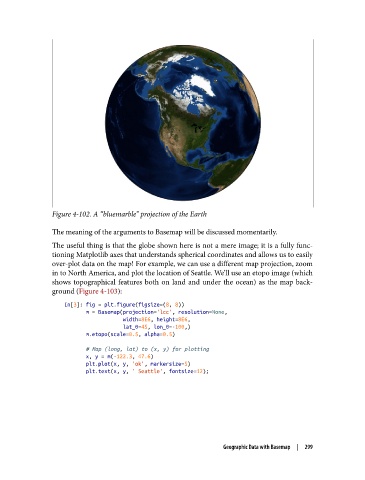
Figure 4-102. A “bluemarble” projection of the Earth

               The meaning of the arguments to Basemap will be discussed momentarily.
               The useful thing is that the globe shown here is not a mere image; it is a fully func‐
               tioning Matplotlib axes that understands spherical coordinates and allows us to easily
               over-plot data on the map! For example, we can use a different map projection, zoom
               in to North America, and plot the location of Seattle. We’ll use an etopo image (which
               shows topographical features both on land and under the ocean) as the map back‐
               ground (Figure 4-103):

                   In[3]: fig = plt.figure(figsize=(8, 8))
                          m = Basemap(projection='lcc', resolution=None,
                                      width=8E6, height=8E6,
                                      lat_0=45, lon_0=-100,)
                          m.etopo(scale=0.5, alpha=0.5)

                          # Map (long, lat) to (x, y) for plotting
                          x, y = m(-122.3, 47.6)
                          plt.plot(x, y, 'ok', markersize=5)
                          plt.text(x, y, ' Seattle', fontsize=12);


                                                               Geographic Data with Basemap  |  299