
Page 319 - Python Data Science Handbook
P. 319
In[4]: from itertools import chain
def draw_map(m, scale=0.2):
# draw a shaded-relief image
m.shadedrelief(scale=scale)
# lats and longs are returned as a dictionary
lats = m.drawparallels(np.linspace(-90, 90, 13))
lons = m.drawmeridians(np.linspace(-180, 180, 13))
# keys contain the plt.Line2D instances
lat_lines = chain(*(tup[1][0] for tup in lats.items()))
lon_lines = chain(*(tup[1][0] for tup in lons.items()))
all_lines = chain(lat_lines, lon_lines)
# cycle through these lines and set the desired style
for line in all_lines:
line.set(linestyle='-', alpha=0.3, color='w')
Cylindrical projections
The simplest of map projections are cylindrical projections, in which lines of constant
latitude and longitude are mapped to horizontal and vertical lines, respectively. This
type of mapping represents equatorial regions quite well, but results in extreme dis‐
tortions near the poles. The spacing of latitude lines varies between different cylindri‐
cal projections, leading to different conservation properties, and different distortion
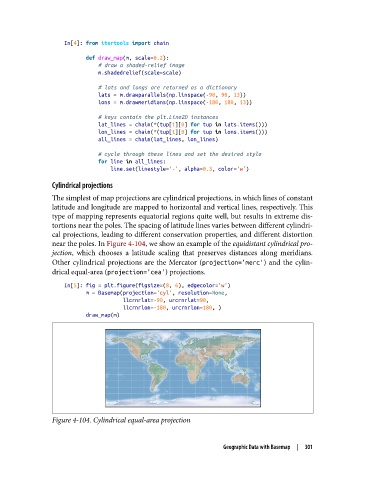
near the poles. In Figure 4-104, we show an example of the equidistant cylindrical pro‐
jection, which chooses a latitude scaling that preserves distances along meridians.
Other cylindrical projections are the Mercator (projection='merc') and the cylin‐
drical equal-area (projection='cea') projections.
In[5]: fig = plt.figure(figsize=(8, 6), edgecolor='w')
m = Basemap(projection='cyl', resolution=None,
llcrnrlat=-90, urcrnrlat=90,
llcrnrlon=-180, urcrnrlon=180, )
draw_map(m)
Figure 4-104. Cylindrical equal-area projection
Geographic Data with Basemap | 301