
Page 321 - Python Data Science Handbook
P. 321
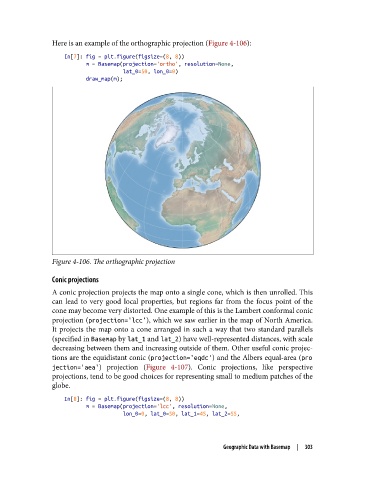
Here is an example of the orthographic projection (Figure 4-106):

                   In[7]: fig = plt.figure(figsize=(8, 8))
                          m = Basemap(projection='ortho', resolution=None,
                                      lat_0=50, lon_0=0)
                          draw_map(m);


               Figure 4-106. The orthographic projection

               Conic projections

               A conic projection projects the map onto a single cone, which is then unrolled. This
               can lead to very good local properties, but regions far from the focus point of the
               cone may become very distorted. One example of this is the Lambert conformal conic
               projection (projection='lcc'), which we saw earlier in the map of North America.
               It projects the map onto a cone arranged in such a way that two standard parallels
               (specified in Basemap by lat_1 and lat_2) have well-represented distances, with scale
               decreasing between them and increasing outside of them. Other useful conic projec‐
               tions are the equidistant conic (projection='eqdc') and the Albers equal-area (pro
               jection='aea') projection (Figure 4-107). Conic projections, like perspective
               projections, tend to be good choices for representing small to medium patches of the
               globe.
                   In[8]: fig = plt.figure(figsize=(8, 8))
                          m = Basemap(projection='lcc', resolution=None,
                                      lon_0=0, lat_0=50, lat_1=45, lat_2=55,


                                                               Geographic Data with Basemap  |  303