
Page 322 - Python Data Science Handbook
P. 322
width=1.6E7, height=1.2E7)
draw_map(m)
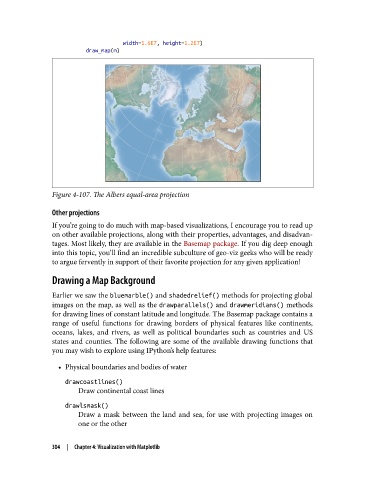
Figure 4-107. The Albers equal-area projection
Other projections
If you’re going to do much with map-based visualizations, I encourage you to read up
on other available projections, along with their properties, advantages, and disadvan‐
tages. Most likely, they are available in the Basemap package. If you dig deep enough
into this topic, you’ll find an incredible subculture of geo-viz geeks who will be ready
to argue fervently in support of their favorite projection for any given application!
Drawing a Map Background
Earlier we saw the bluemarble() and shadedrelief() methods for projecting global
images on the map, as well as the drawparallels() and drawmeridians() methods
for drawing lines of constant latitude and longitude. The Basemap package contains a
range of useful functions for drawing borders of physical features like continents,
oceans, lakes, and rivers, as well as political boundaries such as countries and US
states and counties. The following are some of the available drawing functions that
you may wish to explore using IPython’s help features:
• Physical boundaries and bodies of water
drawcoastlines()
Draw continental coast lines
drawlsmask()
Draw a mask between the land and sea, for use with projecting images on
one or the other
304 | Chapter 4: Visualization with Matplotlib