
Page 40 - Python Data Science Handbook
P. 40
<ipython-input-1-d849e34d61fb> in func1(a=1, b=0)
1 def func1(a, b):
----> 2 return a / b
a = 1
b = 0
3
4 def func2(x):
5 a = x
ZeroDivisionError: division by zero
This extra information can help you narrow in on why the exception is being raised.
So why not use the Verbose mode all the time? As code gets complicated, this kind of
traceback can get extremely long. Depending on the context, sometimes the brevity of
Default mode is easier to work with.
Debugging: When Reading Tracebacks Is Not Enough
The standard Python tool for interactive debugging is pdb, the Python debugger. This
debugger lets the user step through the code line by line in order to see what might be
causing a more difficult error. The IPython-enhanced version of this is ipdb, the
IPython debugger.
There are many ways to launch and use both these debuggers; we won’t cover them
fully here. Refer to the online documentation of these two utilities to learn more.
In IPython, perhaps the most convenient interface to debugging is the %debug magic
command. If you call it after hitting an exception, it will automatically open an inter‐
active debugging prompt at the point of the exception. The ipdb prompt lets you
explore the current state of the stack, explore the available variables, and even run
Python commands!
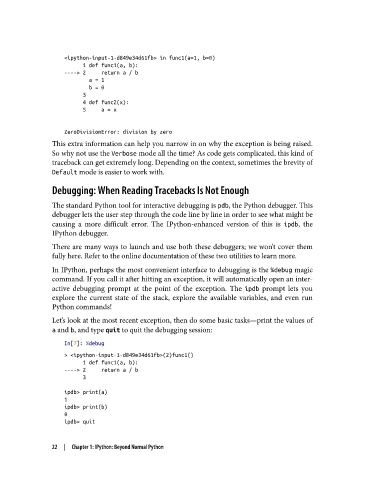
Let’s look at the most recent exception, then do some basic tasks—print the values of
a and b, and type quit to quit the debugging session:
In[7]: %debug
> <ipython-input-1-d849e34d61fb>(2)func1()
1 def func1(a, b):
----> 2 return a / b
3
ipdb> print(a)
1
ipdb> print(b)
0
ipdb> quit
22 | Chapter 1: IPython: Beyond Normal Python