
Page 402 - Python Data Science Handbook
P. 402
In[2]: from sklearn.datasets import make_blobs
X, y = make_blobs(100, 2, centers=2, random_state=2, cluster_std=1.5)
plt.scatter(X[:, 0], X[:, 1], c=y, s=50, cmap='RdBu');
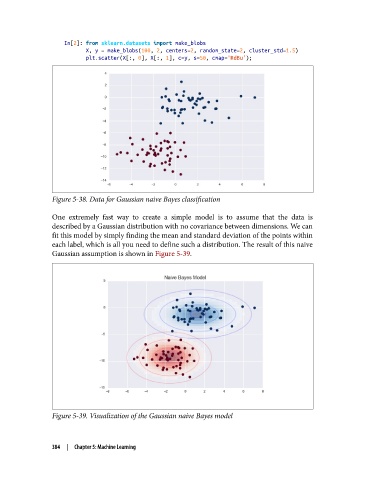
Figure 5-38. Data for Gaussian naive Bayes classification
One extremely fast way to create a simple model is to assume that the data is
described by a Gaussian distribution with no covariance between dimensions. We can
fit this model by simply finding the mean and standard deviation of the points within
each label, which is all you need to define such a distribution. The result of this naive
Gaussian assumption is shown in Figure 5-39.
Figure 5-39. Visualization of the Gaussian naive Bayes model
384 | Chapter 5: Machine Learning