
Page 397 - Python Data Science Handbook
P. 397
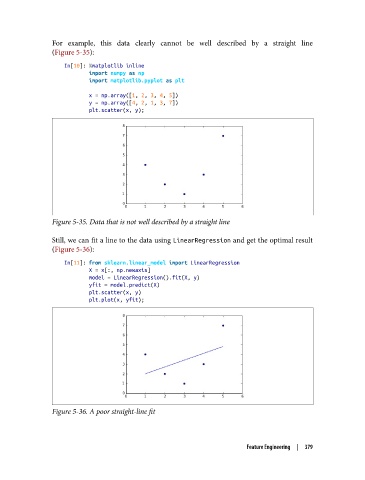
For example, this data clearly cannot be well described by a straight line
               (Figure 5-35):

                   In[10]: %matplotlib inline
                           import numpy as np
                           import matplotlib.pyplot as plt

                           x = np.array([1, 2, 3, 4, 5])
                           y = np.array([4, 2, 1, 3, 7])
                           plt.scatter(x, y);


               Figure 5-35. Data that is not well described by a straight line

               Still, we can fit a line to the data using LinearRegression and get the optimal result
               (Figure 5-36):

                   In[11]: from sklearn.linear_model import LinearRegression
                           X = x[:, np.newaxis]
                           model = LinearRegression().fit(X, y)
                           yfit = model.predict(X)
                           plt.scatter(x, y)
                           plt.plot(x, yfit);


               Figure 5-36. A poor straight-line fit


                                                                     Feature Engineering  |  379