
Page 413 - Python Data Science Handbook
P. 413
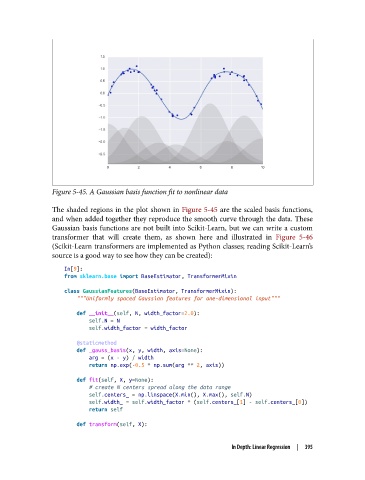
Figure 5-45. A Gaussian basis function fit to nonlinear data

               The shaded regions in the plot shown in Figure 5-45 are the scaled basis functions,
               and when added together they reproduce the smooth curve through the data. These
               Gaussian basis functions are not built into Scikit-Learn, but we can write a custom
               transformer that will create them, as shown here and illustrated in Figure 5-46
               (Scikit-Learn transformers are implemented as Python classes; reading Scikit-Learn’s
               source is a good way to see how they can be created):

                   In[9]:
                   from sklearn.base import BaseEstimator, TransformerMixin

                   class GaussianFeatures(BaseEstimator, TransformerMixin):
                       """Uniformly spaced Gaussian features for one-dimensional input"""
                       def __init__(self, N, width_factor=2.0):
                           self.N = N
                           self.width_factor = width_factor
                       @staticmethod
                       def _gauss_basis(x, y, width, axis=None):
                           arg = (x - y) / width
                           return np.exp(-0.5 * np.sum(arg ** 2, axis))

                       def fit(self, X, y=None):
                           # create N centers spread along the data range
                           self.centers_ = np.linspace(X.min(), X.max(), self.N)
                           self.width_ = self.width_factor * (self.centers_[1] - self.centers_[0])
                           return self
                       def transform(self, X):


                                                                 In Depth: Linear Regression  |  395