
Page 415 - Python Data Science Handbook
P. 415
plt.xlim(0, 10)
plt.ylim(-1.5, 1.5);
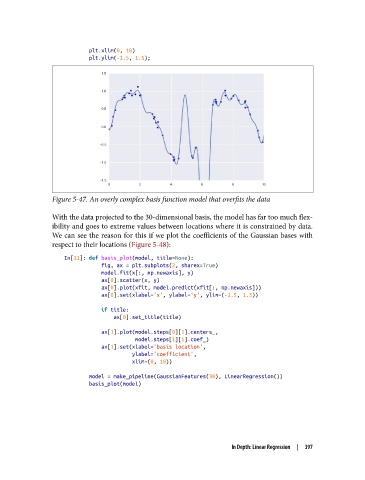
Figure 5-47. An overly complex basis function model that overfits the data
With the data projected to the 30-dimensional basis, the model has far too much flex‐
ibility and goes to extreme values between locations where it is constrained by data.
We can see the reason for this if we plot the coefficients of the Gaussian bases with
respect to their locations (Figure 5-48):
In[11]: def basis_plot(model, title=None):
fig, ax = plt.subplots(2, sharex=True)
model.fit(x[:, np.newaxis], y)
ax[0].scatter(x, y)
ax[0].plot(xfit, model.predict(xfit[:, np.newaxis]))
ax[0].set(xlabel='x', ylabel='y', ylim=(-1.5, 1.5))
if title:
ax[0].set_title(title)
ax[1].plot(model.steps[0][1].centers_,
model.steps[1][1].coef_)
ax[1].set(xlabel='basis location',
ylabel='coefficient',
xlim=(0, 10))
model = make_pipeline(GaussianFeatures(30), LinearRegression())
basis_plot(model)
In Depth: Linear Regression | 397