
Page 424 - Python Data Science Handbook
P. 424
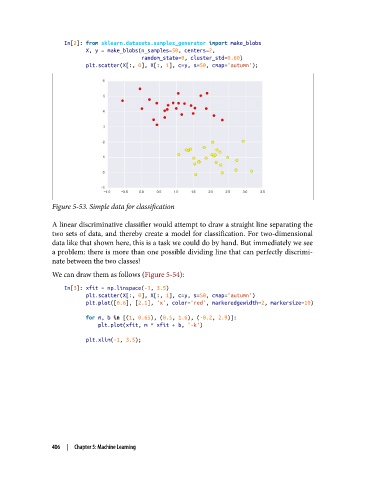
In[2]: from sklearn.datasets.samples_generator import make_blobs
                          X, y = make_blobs(n_samples=50, centers=2,
                                            random_state=0, cluster_std=0.60)
                          plt.scatter(X[:, 0], X[:, 1], c=y, s=50, cmap='autumn');


               Figure 5-53. Simple data for classification

               A linear discriminative classifier would attempt to draw a straight line separating the
               two sets of data, and thereby create a model for classification. For two-dimensional
               data like that shown here, this is a task we could do by hand. But immediately we see
               a problem: there is more than one possible dividing line that can perfectly discrimi‐
               nate between the two classes!
               We can draw them as follows (Figure 5-54):

                   In[3]: xfit = np.linspace(-1, 3.5)
                          plt.scatter(X[:, 0], X[:, 1], c=y, s=50, cmap='autumn')
                          plt.plot([0.6], [2.1], 'x', color='red', markeredgewidth=2, markersize=10)
                          for m, b in [(1, 0.65), (0.5, 1.6), (-0.2, 2.9)]:
                              plt.plot(xfit, m * xfit + b, '-k')

                          plt.xlim(-1, 3.5);


               406  |  Chapter 5: Machine Learning