
Page 425 - Python Data Science Handbook
P. 425
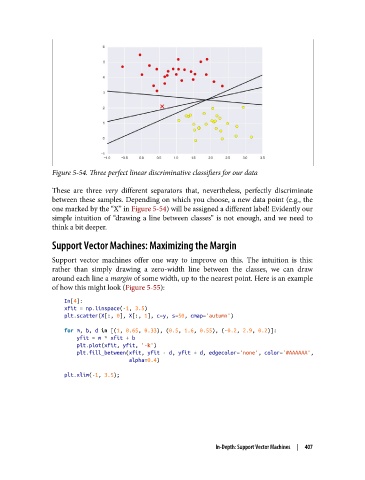
Figure 5-54. Three perfect linear discriminative classifiers for our data

               These are three very  different separators that, nevertheless, perfectly discriminate
               between these samples. Depending on which you choose, a new data point (e.g., the
               one marked by the “X” in Figure 5-54) will be assigned a different label! Evidently our
               simple intuition of “drawing a line between classes” is not enough, and we need to
               think a bit deeper.

               Support Vector Machines: Maximizing the Margin

               Support vector machines offer one way to improve on this. The intuition is this:
               rather than simply drawing a zero-width line between the classes, we can draw
               around each line a margin of some width, up to the nearest point. Here is an example
               of how this might look (Figure 5-55):
                   In[4]:
                   xfit = np.linspace(-1, 3.5)
                   plt.scatter(X[:, 0], X[:, 1], c=y, s=50, cmap='autumn')
                   for m, b, d in [(1, 0.65, 0.33), (0.5, 1.6, 0.55), (-0.2, 2.9, 0.2)]:
                       yfit = m * xfit + b
                       plt.plot(xfit, yfit, '-k')
                       plt.fill_between(xfit, yfit - d, yfit + d, edgecolor='none', color='#AAAAAA',
                                        alpha=0.4)
                   plt.xlim(-1, 3.5);


                                                             In-Depth: Support Vector Machines  |  407