
Page 420 - Python Data Science Handbook
P. 420
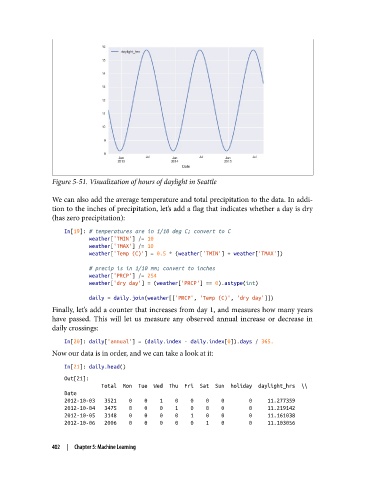
Figure 5-51. Visualization of hours of daylight in Seattle


               We can also add the average temperature and total precipitation to the data. In addi‐
               tion to the inches of precipitation, let’s add a flag that indicates whether a day is dry
               (has zero precipitation):
                   In[19]: # temperatures are in 1/10 deg C; convert to C
                           weather['TMIN'] /= 10
                           weather['TMAX'] /= 10
                           weather['Temp (C)'] = 0.5 * (weather['TMIN'] + weather['TMAX'])

                           # precip is in 1/10 mm; convert to inches
                           weather['PRCP'] /= 254
                           weather['dry day'] = (weather['PRCP'] == 0).astype(int)

                           daily = daily.join(weather[['PRCP', 'Temp (C)', 'dry day']])
               Finally, let’s add a counter that increases from day 1, and measures how many years
               have passed. This will let us measure any observed annual increase or decrease in
               daily crossings:
                   In[20]: daily['annual'] = (daily.index - daily.index[0]).days / 365.
               Now our data is in order, and we can take a look at it:

                   In[21]: daily.head()
                   Out[21]:
                               Total  Mon  Tue  Wed  Thu  Fri  Sat  Sun  holiday  daylight_hrs  \\
                   Date
                   2012-10-03   3521    0    0    1    0    0    0    0        0     11.277359
                   2012-10-04   3475    0    0    0    1    0    0    0        0     11.219142
                   2012-10-05   3148    0    0    0    0    1    0    0        0     11.161038
                   2012-10-06   2006    0    0    0    0    0    1    0        0     11.103056


               402  |  Chapter 5: Machine Learning