
Page 430 - Python Data Science Handbook
P. 430
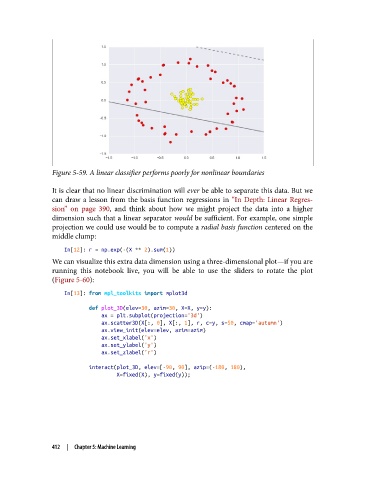
Figure 5-59. A linear classifier performs poorly for nonlinear boundaries

               It is clear that no linear discrimination will ever be able to separate this data. But we
               can draw a lesson from the basis function regressions in “In Depth: Linear Regres‐
               sion”  on page 390, and think about how we might project the data into a higher
               dimension such that a linear separator would be sufficient. For example, one simple
               projection we could use would be to compute a radial basis function centered on the
               middle clump:
                   In[12]: r = np.exp(-(X ** 2).sum(1))
               We can visualize this extra data dimension using a three-dimensional plot—if you are
               running this notebook live, you will be able to use the sliders to rotate the plot
               (Figure 5-60):

                   In[13]: from mpl_toolkits import mplot3d
                           def plot_3D(elev=30, azim=30, X=X, y=y):
                               ax = plt.subplot(projection='3d')
                               ax.scatter3D(X[:, 0], X[:, 1], r, c=y, s=50, cmap='autumn')
                               ax.view_init(elev=elev, azim=azim)
                               ax.set_xlabel('x')
                               ax.set_ylabel('y')
                               ax.set_zlabel('r')

                           interact(plot_3D, elev=[-90, 90], azip=(-180, 180),
                                    X=fixed(X), y=fixed(y));


               412  |  Chapter 5: Machine Learning