
Page 465 - Python Data Science Handbook
P. 465
X[:, 0] *= (data.shape[0] / data.shape[1])
X = X[:N]
return X[np.argsort(X[:, 0])]
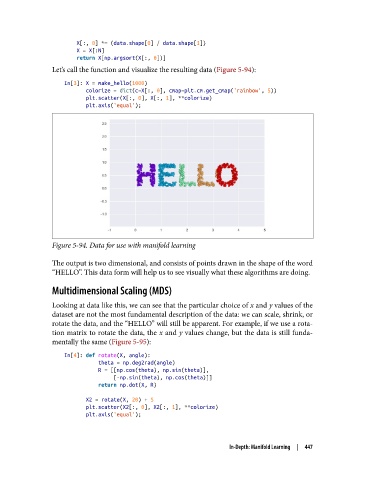
Let’s call the function and visualize the resulting data (Figure 5-94):
In[3]: X = make_hello(1000)
colorize = dict(c=X[:, 0], cmap=plt.cm.get_cmap('rainbow', 5))
plt.scatter(X[:, 0], X[:, 1], **colorize)
plt.axis('equal');
Figure 5-94. Data for use with manifold learning
The output is two dimensional, and consists of points drawn in the shape of the word
“HELLO”. This data form will help us to see visually what these algorithms are doing.
Multidimensional Scaling (MDS)
Looking at data like this, we can see that the particular choice of x and y values of the
dataset are not the most fundamental description of the data: we can scale, shrink, or
rotate the data, and the “HELLO” will still be apparent. For example, if we use a rota‐
tion matrix to rotate the data, the x and y values change, but the data is still funda‐
mentally the same (Figure 5-95):
In[4]: def rotate(X, angle):
theta = np.deg2rad(angle)
R = [[np.cos(theta), np.sin(theta)],
[-np.sin(theta), np.cos(theta)]]
return np.dot(X, R)
X2 = rotate(X, 20) + 5
plt.scatter(X2[:, 0], X2[:, 1], **colorize)
plt.axis('equal');
In-Depth: Manifold Learning | 447