
Page 462 - Python Data Science Handbook
P. 462
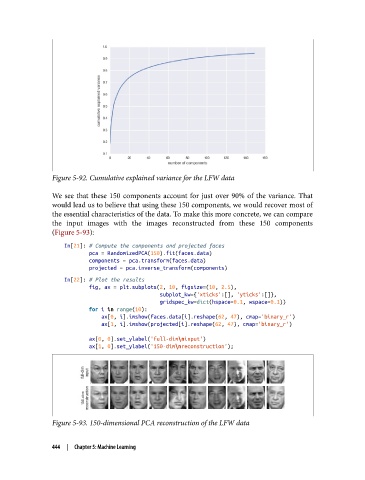
Figure 5-92. Cumulative explained variance for the LFW data

               We see that these 150 components account for just over 90% of the variance. That
               would lead us to believe that using these 150 components, we would recover most of
               the essential characteristics of the data. To make this more concrete, we can compare
               the input images with the images reconstructed from these 150 components
               (Figure 5-93):

                   In[21]: # Compute the components and projected faces
                           pca = RandomizedPCA(150).fit(faces.data)
                           components = pca.transform(faces.data)
                           projected = pca.inverse_transform(components)
                   In[22]: # Plot the results
                           fig, ax = plt.subplots(2, 10, figsize=(10, 2.5),
                                                  subplot_kw={'xticks':[], 'yticks':[]},
                                                  gridspec_kw=dict(hspace=0.1, wspace=0.1))
                           for i in range(10):
                               ax[0, i].imshow(faces.data[i].reshape(62, 47), cmap='binary_r')
                               ax[1, i].imshow(projected[i].reshape(62, 47), cmap='binary_r')

                           ax[0, 0].set_ylabel('full-dim\ninput')
                           ax[1, 0].set_ylabel('150-dim\nreconstruction');


               Figure 5-93. 150-dimensional PCA reconstruction of the LFW data


               444  |  Chapter 5: Machine Learning