
Page 467 - Python Data Science Handbook
P. 467
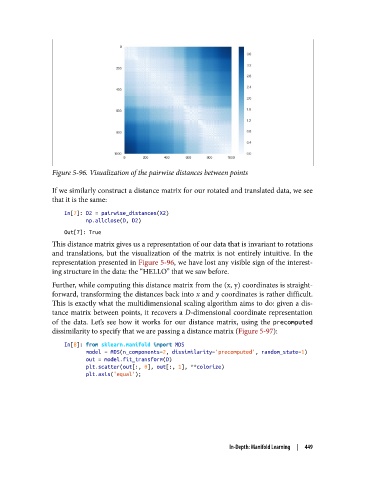
Figure 5-96. Visualization of the pairwise distances between points

               If we similarly construct a distance matrix for our rotated and translated data, we see
               that it is the same:
                   In[7]: D2 = pairwise_distances(X2)
                          np.allclose(D, D2)

                   Out[7]: True
               This distance matrix gives us a representation of our data that is invariant to rotations
               and translations, but the visualization of the matrix is not entirely intuitive. In the
               representation presented in Figure 5-96, we have lost any visible sign of the interest‐
               ing structure in the data: the “HELLO” that we saw before.
               Further, while computing this distance matrix from the (x, y) coordinates is straight‐
               forward, transforming the distances back into x and y coordinates is rather difficult.
               This is exactly what the multidimensional scaling algorithm aims to do: given a dis‐
               tance matrix between points, it recovers a D-dimensional coordinate representation
               of the data. Let’s see how it works for our distance matrix, using the precomputed
               dissimilarity to specify that we are passing a distance matrix (Figure 5-97):

                   In[8]: from sklearn.manifold import MDS
                          model = MDS(n_components=2, dissimilarity='precomputed', random_state=1)
                          out = model.fit_transform(D)
                          plt.scatter(out[:, 0], out[:, 1], **colorize)
                          plt.axis('equal');


                                                                In-Depth: Manifold Learning  |  449