
Page 470 - Python Data Science Handbook
P. 470
certain relationships within the data. In the case of MDS, the quantity preserved is the
distance between every pair of points.
Nonlinear Embeddings: Where MDS Fails
Our discussion so far has considered linear embeddings, which essentially consist of
rotations, translations, and scalings of data into higher-dimensional spaces. Where
MDS breaks down is when the embedding is nonlinear—that is, when it goes beyond
this simple set of operations. Consider the following embedding, which takes the
input and contorts it into an “S” shape in three dimensions:
In[12]: def make_hello_s_curve(X):
t = (X[:, 0] - 2) * 0.75 * np.pi
x = np.sin(t)
y = X[:, 1]
z = np.sign(t) * (np.cos(t) - 1)
return np.vstack((x, y, z)).T
XS = make_hello_s_curve(X)
This is again three-dimensional data, but we can see that the embedding is much
more complicated (Figure 5-100):
In[13]: from mpl_toolkits import mplot3d
ax = plt.axes(projection='3d')
ax.scatter3D(XS[:, 0], XS[:, 1], XS[:, 2],
**colorize);
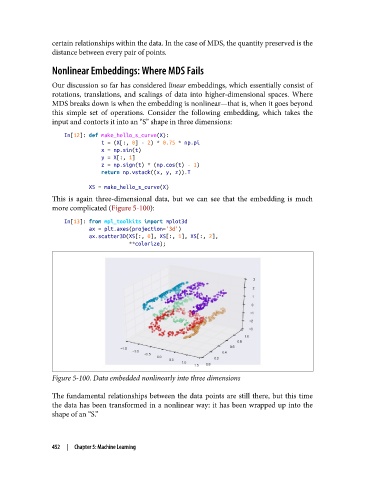
Figure 5-100. Data embedded nonlinearly into three dimensions
The fundamental relationships between the data points are still there, but this time
the data has been transformed in a nonlinear way: it has been wrapped up into the
shape of an “S.”
452 | Chapter 5: Machine Learning