
Page 466 - Python Data Science Handbook
P. 466
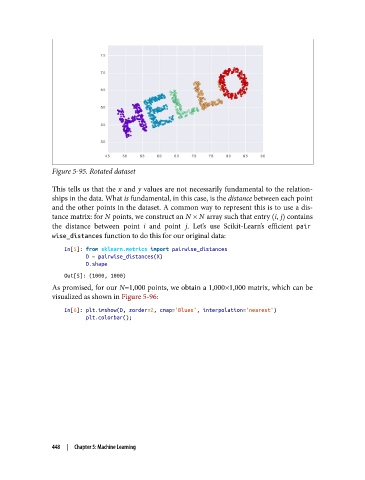
Figure 5-95. Rotated dataset

               This tells us that the x and y values are not necessarily fundamental to the relation‐
               ships in the data. What is fundamental, in this case, is the distance between each point
               and the other points in the dataset. A common way to represent this is to use a dis‐
               tance matrix: for N points, we construct an N × N array such that entry  i, j  contains
               the distance between point i  and point j. Let’s use Scikit-Learn’s efficient pair
               wise_distances function to do this for our original data:
                   In[5]: from sklearn.metrics import pairwise_distances
                          D = pairwise_distances(X)
                          D.shape
                   Out[5]: (1000, 1000)
               As promised, for our N=1,000 points, we obtain a 1,000×1,000 matrix, which can be
               visualized as shown in Figure 5-96:

                   In[6]: plt.imshow(D, zorder=2, cmap='Blues', interpolation='nearest')
                          plt.colorbar();


               448  |  Chapter 5: Machine Learning