
Page 472 - Python Data Science Handbook
P. 472
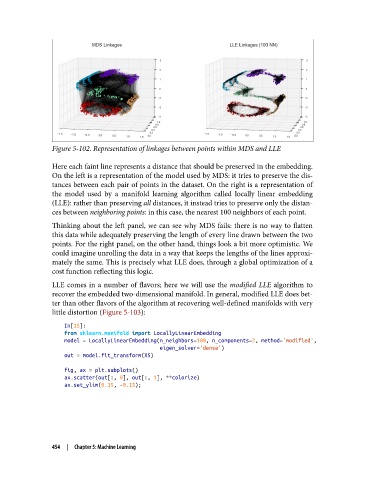
Figure 5-102. Representation of linkages between points within MDS and LLE

               Here each faint line represents a distance that should be preserved in the embedding.
               On the left is a representation of the model used by MDS: it tries to preserve the dis‐
               tances between each pair of points in the dataset. On the right is a representation of
               the model used by a manifold learning algorithm called locally linear embedding
               (LLE): rather than preserving all distances, it instead tries to preserve only the distan‐
               ces between neighboring points: in this case, the nearest 100 neighbors of each point.
               Thinking about the left panel, we can see why MDS fails: there is no way to flatten
               this data while adequately preserving the length of every line drawn between the two
               points. For the right panel, on the other hand, things look a bit more optimistic. We
               could imagine unrolling the data in a way that keeps the lengths of the lines approxi‐
               mately the same. This is precisely what LLE does, through a global optimization of a
               cost function reflecting this logic.
               LLE comes in a number of flavors; here we will use the modified  LLE  algorithm to
               recover the embedded two-dimensional manifold. In general, modified LLE does bet‐
               ter than other flavors of the algorithm at recovering well-defined manifolds with very
               little distortion (Figure 5-103):

                   In[15]:
                   from sklearn.manifold import LocallyLinearEmbedding
                   model = LocallyLinearEmbedding(n_neighbors=100, n_components=2, method='modified',
                                                  eigen_solver='dense')
                   out = model.fit_transform(XS)
                   fig, ax = plt.subplots()
                   ax.scatter(out[:, 0], out[:, 1], **colorize)
                   ax.set_ylim(0.15, -0.15);


               454  |  Chapter 5: Machine Learning