
Page 477 - Python Data Science Handbook
P. 477
shown_images = np.vstack([shown_images, proj[i]])
imagebox = offsetbox.AnnotationBbox(
offsetbox.OffsetImage(images[i], cmap=cmap),
proj[i])
ax.add_artist(imagebox)
Calling this function now, we see the result (Figure 5-106):
In[21]: fig, ax = plt.subplots(figsize=(10, 10))
plot_components(faces.data,
model=Isomap(n_components=2),
images=faces.images[:, ::2, ::2])
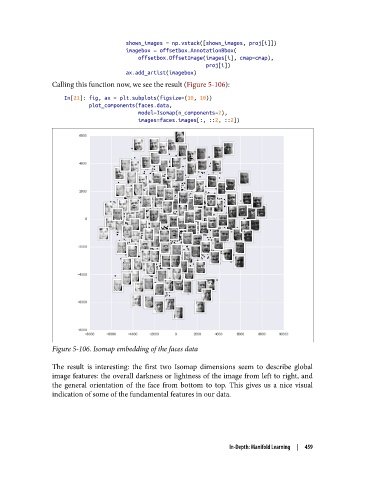
Figure 5-106. Isomap embedding of the faces data
The result is interesting: the first two Isomap dimensions seem to describe global
image features: the overall darkness or lightness of the image from left to right, and
the general orientation of the face from bottom to top. This gives us a nice visual
indication of some of the fundamental features in our data.
In-Depth: Manifold Learning | 459