
Page 479 - Python Data Science Handbook
P. 479
In[24]:
# use only 1/30 of the data: full dataset takes a long time!
data = mnist.data[::30]
target = mnist.target[::30]
model = Isomap(n_components=2)
proj = model.fit_transform(data)
plt.scatter(proj[:, 0], proj[:, 1], c=target, cmap=plt.cm.get_cmap('jet', 10))
plt.colorbar(ticks=range(10))
plt.clim(-0.5, 9.5);
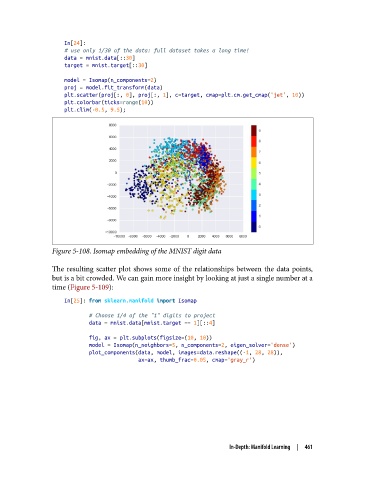
Figure 5-108. Isomap embedding of the MNIST digit data
The resulting scatter plot shows some of the relationships between the data points,
but is a bit crowded. We can gain more insight by looking at just a single number at a
time (Figure 5-109):
In[25]: from sklearn.manifold import Isomap
# Choose 1/4 of the "1" digits to project
data = mnist.data[mnist.target == 1][::4]
fig, ax = plt.subplots(figsize=(10, 10))
model = Isomap(n_neighbors=5, n_components=2, eigen_solver='dense')
plot_components(data, model, images=data.reshape((-1, 28, 28)),
ax=ax, thumb_frac=0.05, cmap='gray_r')
In-Depth: Manifold Learning | 461