
Page 478 - Python Data Science Handbook
P. 478
We could then go on to classify this data, perhaps using manifold features as inputs to
the classification algorithm as we did in “In-Depth: Support Vector Machines” on
page 405.
Example: Visualizing Structure in Digits
As another example of using manifold learning for visualization, let’s take a look at
the MNIST handwritten digits set. This data is similar to the digits we saw in “In-
Depth: Decision Trees and Random Forests” on page 421, but with many more pixels
per image. It can be downloaded from http://mldata.org/ with the Scikit-Learn utility:
In[22]: from sklearn.datasets import fetch_mldata
mnist = fetch_mldata('MNIST original')
mnist.data.shape
Out[22]: (70000, 784)
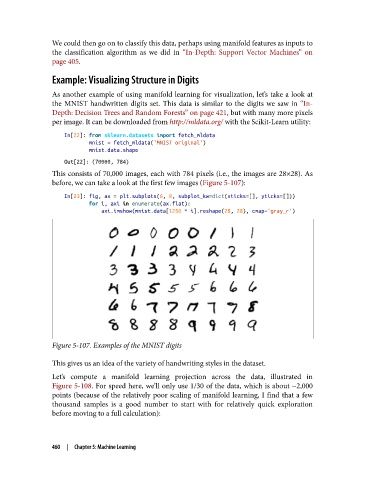
This consists of 70,000 images, each with 784 pixels (i.e., the images are 28×28). As
before, we can take a look at the first few images (Figure 5-107):
In[23]: fig, ax = plt.subplots(6, 8, subplot_kw=dict(xticks=[], yticks=[]))
for i, axi in enumerate(ax.flat):
axi.imshow(mnist.data[1250 * i].reshape(28, 28), cmap='gray_r')
Figure 5-107. Examples of the MNIST digits
This gives us an idea of the variety of handwriting styles in the dataset.
Let’s compute a manifold learning projection across the data, illustrated in
Figure 5-108. For speed here, we’ll only use 1/30 of the data, which is about ~2,000
points (because of the relatively poor scaling of manifold learning, I find that a few
thousand samples is a good number to start with for relatively quick exploration
before moving to a full calculation):
460 | Chapter 5: Machine Learning