
Page 483 - Python Data Science Handbook
P. 483
points—an exhaustive search would be very, very costly. Fortunately for us, such an
exhaustive search is not necessary; instead, the typical approach to k-means involves
an intuitive iterative approach known as expectation–maximization.
k-Means Algorithm: Expectation–Maximization
Expectation–maximization (E–M) is a powerful algorithm that comes up in a variety
of contexts within data science. k-means is a particularly simple and easy-to-
understand application of the algorithm, and we will walk through it briefly here. In
short, the expectation–maximization approach consists of the following procedure:
1. Guess some cluster centers
2. Repeat until converged
a. E-Step: assign points to the nearest cluster center
b. M-Step: set the cluster centers to the mean
Here the “E-step” or “Expectation step” is so named because it involves updating our
expectation of which cluster each point belongs to. The “M-step” or “Maximization
step” is so named because it involves maximizing some fitness function that defines
the location of the cluster centers—in this case, that maximization is accomplished by
taking a simple mean of the data in each cluster.
The literature about this algorithm is vast, but can be summarized as follows: under
typical circumstances, each repetition of the E-step and M-step will always result in a
better estimate of the cluster characteristics.
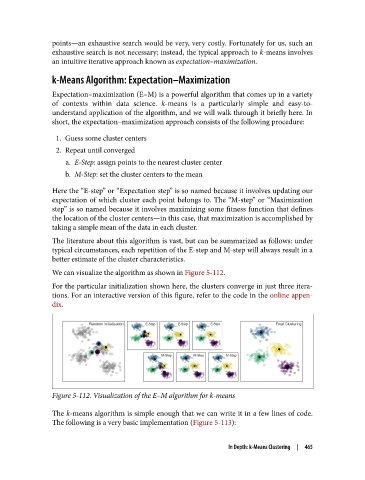
We can visualize the algorithm as shown in Figure 5-112.
For the particular initialization shown here, the clusters converge in just three itera‐
tions. For an interactive version of this figure, refer to the code in the online appen‐
dix.
Figure 5-112. Visualization of the E–M algorithm for k-means
The k-means algorithm is simple enough that we can write it in a few lines of code.
The following is a very basic implementation (Figure 5-113):
In Depth: k-Means Clustering | 465