
Page 486 - Python Data Science Handbook
P. 486
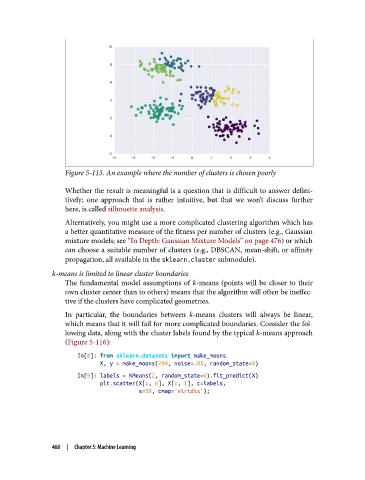
Figure 5-115. An example where the number of clusters is chosen poorly

                   Whether the result is meaningful is a question that is difficult to answer defini‐
                   tively; one approach that is rather intuitive, but that we won’t discuss further
                   here, is called silhouette analysis.
                   Alternatively, you might use a more complicated clustering algorithm which has
                   a better quantitative measure of the fitness per number of clusters (e.g., Gaussian
                   mixture models; see “In Depth: Gaussian Mixture Models” on page 476) or which
                   can choose a suitable number of clusters (e.g., DBSCAN, mean-shift, or affinity
                   propagation, all available in the sklearn.cluster submodule).
               k-means is limited to linear cluster boundaries
                   The fundamental model assumptions of k-means (points will be closer to their
                   own cluster center than to others) means that the algorithm will often be ineffec‐
                   tive if the clusters have complicated geometries.
                   In particular, the boundaries between k-means clusters will always be linear,
                   which means that it will fail for more complicated boundaries. Consider the fol‐
                   lowing data, along with the cluster labels found by the typical k-means approach
                   (Figure 5-116):

                      In[8]: from sklearn.datasets import make_moons
                             X, y = make_moons(200, noise=.05, random_state=0)
                      In[9]: labels = KMeans(2, random_state=0).fit_predict(X)
                             plt.scatter(X[:, 0], X[:, 1], c=labels,
                                         s=50, cmap='viridis');


               468  |  Chapter 5: Machine Learning