
Page 88 - Python Data Science Handbook
P. 88
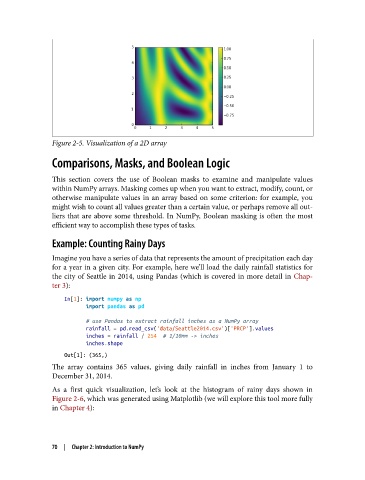
Figure 2-5. Visualization of a 2D array

               Comparisons, Masks, and Boolean Logic

               This section covers the use of Boolean masks to examine and manipulate values
               within NumPy arrays. Masking comes up when you want to extract, modify, count, or
               otherwise manipulate values in an array based on some criterion: for example, you
               might wish to count all values greater than a certain value, or perhaps remove all out‐
               liers that are above some threshold. In NumPy, Boolean masking is often the most
               efficient way to accomplish these types of tasks.

               Example: Counting Rainy Days

               Imagine you have a series of data that represents the amount of precipitation each day
               for a year in a given city. For example, here we’ll load the daily rainfall statistics for
               the city of Seattle in 2014, using Pandas (which is covered in more detail in Chap‐
               ter 3):

                   In[1]: import numpy as np
                          import pandas as pd

                          # use Pandas to extract rainfall inches as a NumPy array
                          rainfall = pd.read_csv('data/Seattle2014.csv')['PRCP'].values
                          inches = rainfall / 254  # 1/10mm -> inches
                          inches.shape
                   Out[1]: (365,)
               The array contains 365 values, giving daily rainfall in inches from January 1 to
               December 31, 2014.
               As a first quick visualization, let’s look at the histogram of rainy days shown in
               Figure 2-6, which was generated using Matplotlib (we will explore this tool more fully
               in Chapter 4):


               70  |  Chapter 2: Introduction to NumPy