
Page 89 - Python Data Science Handbook
P. 89
In[2]: %matplotlib inline
import matplotlib.pyplot as plt
import seaborn; seaborn.set() # set plot styles
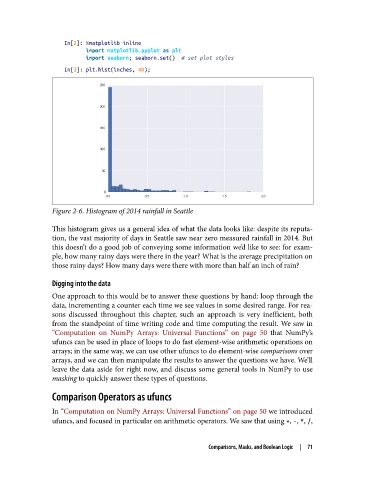
In[3]: plt.hist(inches, 40);
Figure 2-6. Histogram of 2014 rainfall in Seattle
This histogram gives us a general idea of what the data looks like: despite its reputa‐
tion, the vast majority of days in Seattle saw near zero measured rainfall in 2014. But
this doesn’t do a good job of conveying some information we’d like to see: for exam‐
ple, how many rainy days were there in the year? What is the average precipitation on
those rainy days? How many days were there with more than half an inch of rain?
Digging into the data
One approach to this would be to answer these questions by hand: loop through the
data, incrementing a counter each time we see values in some desired range. For rea‐
sons discussed throughout this chapter, such an approach is very inefficient, both
from the standpoint of time writing code and time computing the result. We saw in
“Computation on NumPy Arrays: Universal Functions” on page 50 that NumPy’s
ufuncs can be used in place of loops to do fast element-wise arithmetic operations on
arrays; in the same way, we can use other ufuncs to do element-wise comparisons over
arrays, and we can then manipulate the results to answer the questions we have. We’ll
leave the data aside for right now, and discuss some general tools in NumPy to use
masking to quickly answer these types of questions.
Comparison Operators as ufuncs
In “Computation on NumPy Arrays: Universal Functions” on page 50 we introduced
ufuncs, and focused in particular on arithmetic operators. We saw that using +, -, *, /,
Comparisons, Masks, and Boolean Logic | 71