
Page 412 - Math Smart - 7
P. 412
We can also express the quantity of each type of item in Evan's refrigerator as
a percentage.
100%
X
I X 100% = 0.25 X 100% X 100% = 0.1 x 100% |
=
X
100%
0.4
= 25% = 10% = 40%
Each part of the pie chart can represent the quantity
of each item as a number, a fraction or a percentage. Vegetables:
25% &
—
Meat W
Fish 25% ,/
10% a
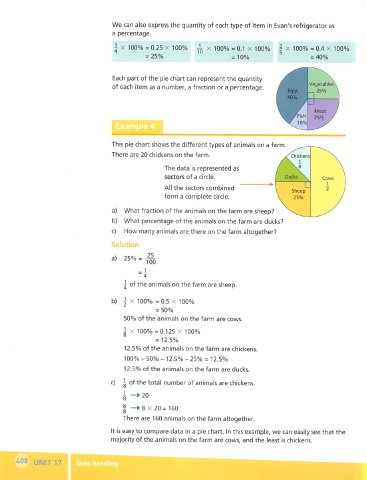
This pie chart shows the different types of animals on a farm.
There are 20 chickens on the farm. Xchickens
The data is represented as
sectors of a circle. Cows
All the sectors combined
form a complete circle.
a) What fraction of the animals on the farm are sheep?
b) What percentage of the animals on the farm are ducks?
c) How many animals are there on the farm altogether?
Solution
25
a) 25% =
100
_ 1
4
^ of the animals on the farm are sheep.
b) 1 X 100% =0.5 X 100%
= 50%
50% of the animals on the farm are cows.
I X 100% =0.125 X 100%
® = 12.50/0
12.5% of the animals on the farm are chickens.
100% - 50% - 12.5% - 25% = 12.5%
12.5% of the animals on the farm are ducks.
c) 1 of the total number of animals are chickens.
1 -»-20
I —►s X 20 = 160
There are 160 animals on the farm altogether.
It is easy to compare data in a pie chart. In this example, we can easily see that the
majority of the animals on the farm are cows, and the least is chickens.
^08 UNIT 17