
Page 413 - Math Smart - 7
P. 413
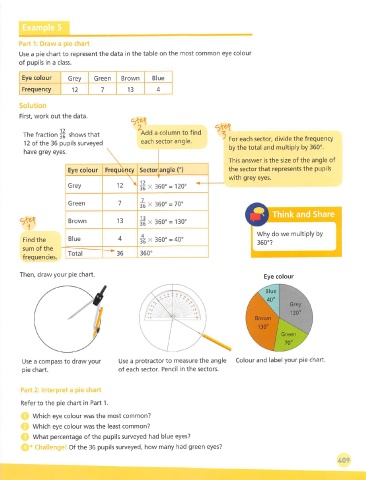
Part 1: Draw a pie chart
       Use a pie chart to represent the data in the table on the most common eye colour
       of pupils in a class.

        Eye colour     Grey     Green   Brown     Blue

        Frequency       12        7       13        4

       Solution
       First, work out the data.

        The fraction^ shows that               Add a column to find

         12 of the 36 pupils surveyed          each sector angle.          For each sector, divide the frequency
                                                                           by the total and multiply by 360°.
                                                                           This answer is the size of the angle of
                       Eye colour Frequ^icy Sector angle (°)               the sector that represents the pupils
                                                                           with grey eyes.
                       Grey                         50° = 120°  '


                       Green           7      ^ X 360° = 70°
                                                                                         Think and Share
                       Brown           13          360° = 130°
          1
                                                                                                multiply
        Find the       Blue            4      ^ X 360° = 40°
        sum of the
                       Total      ^"*^36      360°
        frequencies.

       Then, draw your pie chart.                                                      Eye colour


                                                                                    Brown
                                                                                                    m

                                                                                            Green


        Use a compass to draw your      Use a protractor to measure the angle  Colour and label your pie chart,
        pie chart.                     of each sector. Pencil in the sectors.


        Part 2: Interpret a pie chart
        Refer to the pie chart in Part 1.

            Which eye colour was the most common?
            Which eye colour was the least common?
            What percentage of the pupils surveyed had blue eyes?
                      I
           *
       ^ Challenge Of the 36 pupils surveyed, how many had green eyes?
                                                                                                               409