
Page 13 - Computing book 6
P. 13
Analysing Data Class 6
Chart Layout and Styles:
After inserting a chart, there are several things you may want to change about the way your data is
displayed. It is easy to edit a chart's layout and style from the Design tab.
Excel allows you to add chart elements—such as chart titles, legends, and data labels—to make
your chart easier to read. To add a chart element, click the Add Chart Element command on the
Design tab, then choose the desired element from the drop-down menu.
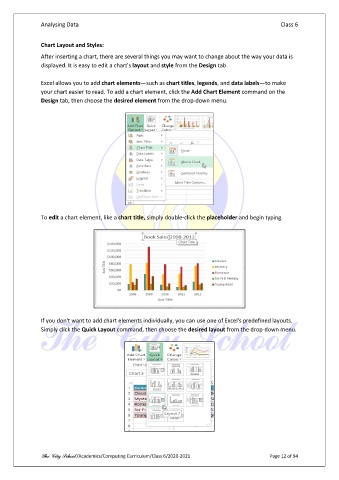
To edit a chart element, like a chart title, simply double-click the placeholder and begin typing.
If you don't want to add chart elements individually, you can use one of Excel's predefined layouts.
Simply click the Quick Layout command, then choose the desired layout from the drop-down menu.
The City School /Academics/Computing Curriculum/Class 6/2020-2021 Page 12 of 94