
Page 14 - Computing book 6
P. 14
Analysing Data Class 6
Add a Legend to a Chart:
Most charts use some kind of a legend to help readers understand the charted data. Whenever you
create a chart in Excel, a legend for the chart is automatically generated at the same time. A chart
can be missing a legend if it has been manually removed from the chart, but you can retrieve the
missing legend.
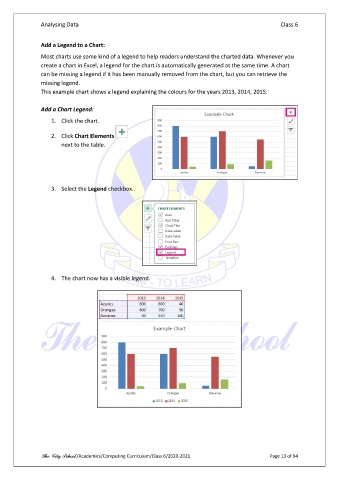
This example chart shows a legend explaining the colours for the years 2013, 2014, 2015.
Add a Chart Legend:
1. Click the chart.
2. Click Chart Elements
next to the table.
3. Select the Legend checkbox.
4. The chart now has a visible legend.
The City School /Academics/Computing Curriculum/Class 6/2020-2021 Page 13 of 94