Page 293 - Hall et al (2015) Principles of Critical Care-McGraw-Hill
P. 293

CHAPTER 28: Interpretation of Hemodynamic Waveforms  197


                                             60


                                                                            v
                                             40

                                             20
                                                                   Balloon deflated


                                                      S
                                              60
                                                        v
                                              40


                                              20
                                                                   Catheter retracted

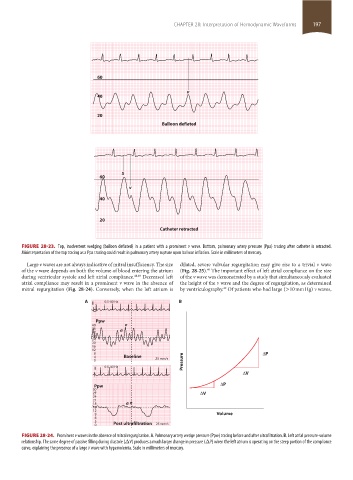
                    FIGURE 28-23.  Top, inadvertent wedging (balloon deflated) in a patient with a prominent  v wave. Bottom, pulmonary artery pressure (Ppa) tracing after catheter is retracted.
                    Misinterpretation of the top tracing as a Ppa tracing could result in pulmonary artery rupture upon balloon inflation. Scale in millimeters of mercury.
                     Large v waves are not always indicative of mitral insufficiency. The size   dilated, severe valvular regurgitation may give rise to a trivial v wave
                    of the v wave depends on both the volume of blood entering the atrium   (Fig. 28-25).  The important effect of left atrial compliance on the size
                                                                                   49
                    during ventricular systole and left atrial compliance. 48,49  Decreased left   of the v wave was demonstrated by a study that simultaneously evaluated
                    atrial compliance may result in a prominent v wave in the absence of   the height of the v wave and the degree of regurgitation, as determined
                                                                                        49
                    mitral regurgitation  (Fig. 28-24). Conversely, when  the  left atrium  is   by ventriculography.  Of patients who had large (>10 mm Hg) v waves,
                                         A  II  0.5-40 Hz                B


                                             Ppw
                                            40         v
                                            36       a
                                            32
                                            28
                                            24
                                            20
                                            16
                                            12
                                            8                                                          P
                                            4         Baseline   25 mm/s
                                            0                              Pressure
                                            II  0.5-40 Hz
                                                                                                V
                                            Ppw                                         P
                                            30
                                            27                                   V
                                            24
                                            21
                                            18         a  v
                                            15
                                            12
                                            9                                         Volume
                                            6
                                            3
                                            0      Post ultrafiltration  25 mm/s
                    FIGURE 28-24.  Prominent v waves in the absence of mitral regurgitation. A. Pulmonary artery wedge pressure (Ppw) tracing before and after ultrafiltration. B. Left atrial pressure-volume
                    relationship. The same degree of passive filling during diastole (ΔV) produces a much larger change in pressure (ΔP) when the left atrium is operating on the steep portion of the compliance
                    curve, explaining the presence of a large v wave with hypervolemia. Scale in millimeters of mercury.


            section02.indd   197                                                                                       1/13/2015   2:05:39 PM
   288   289   290   291   292   293   294   295   296   297   298