
Page 376 - Clinical Application of Mechanical Ventilation
P. 376
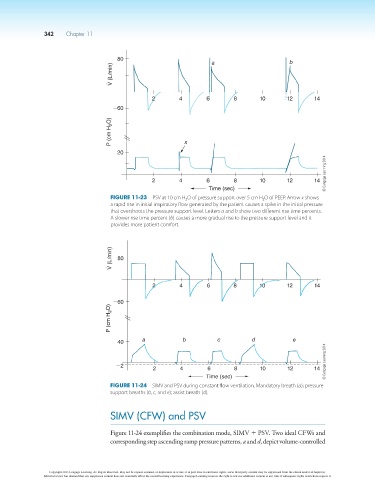
342    Chapter 11


                                              80                             a                        b
                                            V (L/min)


                                                         2        4        6        8       10       12       14
                                            260
                                            P (cm H 2 O)            x


                                              20
                                                                                                                  © Cengage Learning 2014


                                                         2        4        6        8       10       12       14
                                                                            Time (sec)
                                            Figure 11-23  PSV at 10 cm H 2 O of pressure support over 5 cm H 2 O of PEEP. Arrow x shows
                                            a rapid rise in initial inspiratory flow generated by the patient causes a spike in the initial pressure
                                            that overshoots the pressure support level. Letters a and b show two different rise time percents.
                                            A slower rise time percent (b) causes a more gradual rise to the pressure support level and it
                                            provides more patient comfort.


                                            V (L/min)  80


                                                         2        4        6        8       10       12       14

                                            260
                                           P (cm H 2 O)


                                              40      a            b           c          d            e
                                                                                                                  © Cengage Learning 2014


                                             22           2       4        6        8       10       12       14
                                                                           Time (sec)
                                            Figure 11-24  SIMV and PSV during constant flow ventilation. Mandatory breath (a); pressure
                                            support breaths (b, c, and e); assist breath (d).


                                            SIMV (CFW) and PSV


                                            Figure 11-24 exemplifies the combination mode, SIMV 1 PSV. Two ideal CFWs and
                                            corresponding step ascending ramp pressure patterns, a and d, depict volume-controlled


                        Copyright 2013 Cengage Learning. All Rights Reserved. May not be copied, scanned, or duplicated, in whole or in part. Due to electronic rights, some third party content may be suppressed from the eBook and/or eChapter(s).
                      Editorial review has deemed that any suppressed content does not materially affect the overall learning experience. Cengage Learning reserves the right to remove additional content at any time if subsequent rights restrictions require it.