
Page 378 - Clinical Application of Mechanical Ventilation
P. 378
344 Chapter 11
V (L/min) 120 A B
2 4 6 8 10 12 14
260
P (cm H 2 O) 40 a b
© Cengage Learning 2014
2 4 6 8 10 12 14
Time (sec)
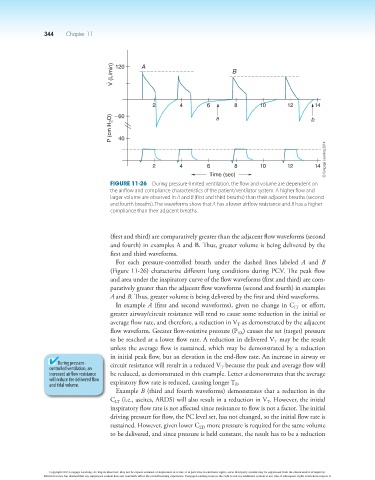
Figure 11-26 During pressure-limited ventilation, the flow and volume are dependent on
the airflow and compliance characteristics of the patient/ventilator system. A higher flow and
larger volume are observed in A and B (first and third breaths) than their adjacent breaths (second
and fourth breaths). The waveforms show that A has a lower airflow resistance and B has a higher
compliance than their adjacent breaths.
(first and third) are comparatively greater than the adjacent flow waveforms (second
and fourth) in examples A and B. Thus, greater volume is being delivered by the
first and third waveforms.
For each pressure-controlled breath under the dashed lines labeled A and B
(Figure 11-26) characterize different lung conditions during PCV. The peak flow
and area under the inspiratory curve of the flow waveforms (first and third) are com-
paratively greater than the adjacent flow waveforms (second and fourth) in examples
A and B. Thus, greater volume is being delivered by the first and third waveforms.
In example A (first and second waveforms), given no change in C or effort,
LT
greater airway/circuit resistance will tend to cause some reduction in the initial or
average flow rate, and therefore, a reduction in V as demonstrated by the adjacent
T
flow waveform. Greater flow-resistive pressure (P ) causes the set (target) pressure
TA
to be reached at a lower flow rate. A reduction in delivered V may be the result
T
unless the average flow is sustained, which may be demonstrated by a reduction
in initial peak flow, but an elevation in the end-flow rate. An increase in airway or
During pressure- circuit resistance will result in a reduced V because the peak and average flow will
controlled ventilation, an T
increased airflow resistance be reduced, as demonstrated in this example. Letter a demonstrates that the average
will reduce the delivered flow expiratory flow rate is reduced, causing longer T .
and tidal volume. E
Example B (third and fourth waveforms) demonstrates that a reduction in the
C (i.e., ascites, ARDS) will also result in a reduction in V . However, the initial
T
LT
inspiratory flow rate is not affected since resistance to flow is not a factor. The initial
driving pressure for flow, the PC level set, has not changed, so the initial flow rate is
sustained. However, given lower C , more pressure is required for the same volume
LT
to be delivered, and since pressure is held constant, the result has to be a reduction
Copyright 2013 Cengage Learning. All Rights Reserved. May not be copied, scanned, or duplicated, in whole or in part. Due to electronic rights, some third party content may be suppressed from the eBook and/or eChapter(s).
Editorial review has deemed that any suppressed content does not materially affect the overall learning experience. Cengage Learning reserves the right to remove additional content at any time if subsequent rights restrictions require it.