
Page 380 - Clinical Application of Mechanical Ventilation
P. 380
346 Chapter 11
15
P (cm H 2 O) Response
Time
© Cengage Learning 2014
2 3 4 5
22
Time (sec)
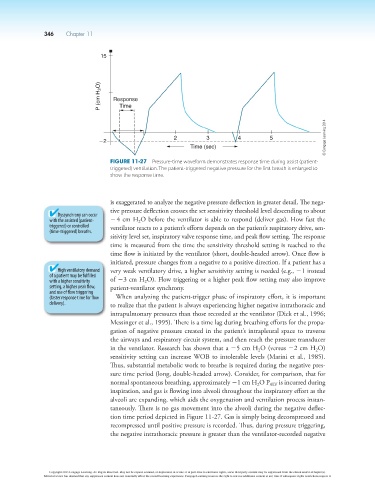
Figure 11-27 Pressure-time waveform demonstrates response time during assist (patient-
triggered) ventilation. The patient-triggered negative pressure for the first breath is enlarged to
show the response time.
is exaggerated to analyze the negative pressure deflection in greater detail. The nega-
tive pressure deflection crosses the set sensitivity threshold level descending to about
Dyssynchrony can occur
with the assisted (patient- 2 4 cm H O before the ventilator is able to respond (deliver gas). How fast the
2
triggered) or controlled ventilator reacts to a patient’s efforts depends on the patient’s respiratory drive, sen-
(time-triggered) breaths.
sitivity level set, inspiratory valve response time, and peak flow setting. The response
time is measured from the time the sensitivity threshold setting is reached to the
time flow is initiated by the ventilator (short, double-headed arrow). Once flow is
initiated, pressure changes from a negative to a positive direction. If a patient has a
High ventilatory demand very weak ventilatory drive, a higher sensitivity setting is needed (e.g., 21 instead
of a patient may be fulfilled
with a higher sensitivity of 23 cm H O). Flow triggering or a higher peak flow setting may also improve
2
setting, a higher peak flow, patient-ventilator synchrony.
and use of flow triggering
(faster response time for flow When analyzing the patient-trigger phase of inspiratory effort, it is important
delivery). to realize that the patient is always experiencing higher negative intrathoracic and
intrapulmonary pressures than those recorded at the ventilator (Dick et al., 1996;
Messinger et al., 1995). There is a time lag during breathing efforts for the propa-
gation of negative pressure created in the patient’s intrapleural space to traverse
the airways and respiratory circuit system, and then reach the pressure transducer
in the ventilator. Research has shown that a 25 cm H O (versus 22 cm H O)
2
2
sensitivity setting can increase WOB to intolerable levels (Marini et al., 1985).
Thus, substantial metabolic work to breathe is required during the negative pres-
sure time period (long, double-headed arrow). Consider, for comparison, that for
normal spontaneous breathing, approximately 21 cm H O P ALV is incurred during
2
inspiration, and gas is flowing into alveoli throughout the inspiratory effort as the
alveoli are expanding, which aids the oxygenation and ventilation process instan-
taneously. There is no gas movement into the alveoli during the negative deflec-
tion time period depicted in Figure 11-27. Gas is simply being decompressed and
recompressed until positive pressure is recorded. Thus, during pressure triggering,
the negative intrathoracic pressure is greater than the ventilator-recorded negative
Copyright 2013 Cengage Learning. All Rights Reserved. May not be copied, scanned, or duplicated, in whole or in part. Due to electronic rights, some third party content may be suppressed from the eBook and/or eChapter(s).
Editorial review has deemed that any suppressed content does not materially affect the overall learning experience. Cengage Learning reserves the right to remove additional content at any time if subsequent rights restrictions require it.