
Page 385 - Clinical Application of Mechanical Ventilation
P. 385
Ventilator Waveform Analysis 351
increase in pressure during this period of time. Any movement such as turning or
twisting of the thorax can cause pressure to rise. Hands placed on the patient’s chest
while being attended by a health care provider can increase intrathoracic pressure
and peak P ALV . The patient trying to talk or cough will increase P ALV .
Letter b (Figure 11-30) shows the patient may be trying to continue to inspire,
Patient-ventilator thus expanding thoracic volume, decompressing gas in the system, and dropping
dyssynchrony with decreas-
ing airway pressure may pressure. There may be a small leak in the circuit, causing pressure to drop during
occur with a small leak in the the pause. Using graphics, you will learn with experience that it is very difficult to obtain
ventilator circuit or when the
patient continues to inspire accurate respiratory mechanics measurements. Without graphics, errors cannot be
during the pause time. observed and may be documented as fact. Patients have to be totally relaxed and
passive during the static compliance measurement. Usually, only the CMV mode
can be used during respiratory mechanics measurements. Often, the minute ven-
tilation has to be increased 10% to 15% to reduce the patient’s PaCO to apneic
2
threshold (about 32 mm Hg), to eliminate patient’s respiratory drive and induce
relaxation, and to obtain valid measurements (Marini et al., 1985, 1986).
Dyssynchrony during Pressure-Controlled
Ventilation
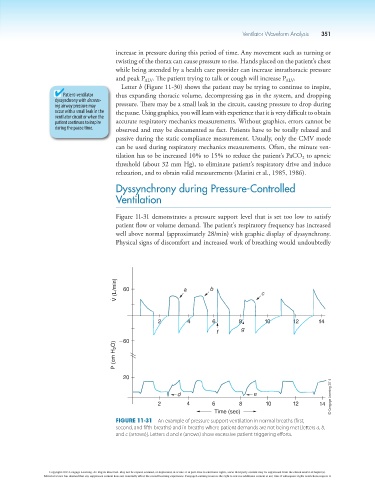
Figure 11-31 demonstrates a pressure support level that is set too low to satisfy
patient flow or volume demand. The patient’s respiratory frequency has increased
well above normal (approximately 28/min) with graphic display of dyssynchrony.
Physical signs of discomfort and increased work of breathing would undoubtedly
V (L/min) 60 a b c
2 4 6 8 10 12 14
g
f
260
P (cm H 2 O)
20
d e © Cengage Learning 2014
2 4 6 8 10 12 14
Time (sec)
Figure 11-31 An example of pressure support ventilation in normal breaths (first,
second, and fifth breaths) and in breaths where patient demands are not being met [letters a, b,
and c (arrows)]. Letters d and e (arrows) show excessive patient triggering efforts.
Copyright 2013 Cengage Learning. All Rights Reserved. May not be copied, scanned, or duplicated, in whole or in part. Due to electronic rights, some third party content may be suppressed from the eBook and/or eChapter(s).
Editorial review has deemed that any suppressed content does not materially affect the overall learning experience. Cengage Learning reserves the right to remove additional content at any time if subsequent rights restrictions require it.