
Page 387 - Clinical Application of Mechanical Ventilation
P. 387
Ventilator Waveform Analysis 353
80
V (L/min)
1 2 3 4 5 6 7
Lost Volume
P (cm H 2 O) 280
60
© Cengage Learning 2014
1 2 3 4 5 6 7
Time (sec)
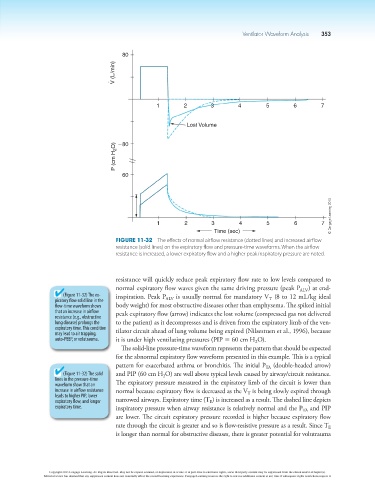
Figure 11-32 The effects of normal airflow resistance (dotted lines) and increased airflow
resistance (solid lines) on the expiratory flow and pressure-time waveforms. When the airflow
resistance is increased, a lower expiratory flow and a higher peak inspiratory pressure are noted.
resistance will quickly reduce peak expiratory flow rate to low levels compared to
normal expiratory flow waves given the same driving pressure (peak P ALV ) at end-
(Figure 11-32) The ex- inspiration. Peak P is usually normal for mandatory V (8 to 12 mL/kg ideal
piratory flow solid line in the ALV T
flow-time waveform shows body weight) for most obstructive diseases other than emphysema. The spiked initial
that an increase in airflow peak expiratory flow (arrow) indicates the lost volume (compressed gas not delivered
resistance (e.g., obstructive
lung disease) prolongs the to the patient) as it decompresses and is driven from the expiratory limb of the ven-
expiratory time. This condition tilator circuit ahead of lung volume being expired (Nilsestuen et al., 1996), because
may lead to air trapping,
auto-PEEP, or volutrauma. it is under high ventilating pressures (PIP 5 60 cm H O).
2
The solid-line pressure-time waveform represents the pattern that should be expected
for the abnormal expiratory flow waveform presented in this example. This is a typical
pattern for exacerbated asthma or bronchitis. The initial P (double-headed arrow)
TA
(Figure 11-32) The solid and PIP (60 cm H O) are well above typical levels caused by airway/circuit resistance.
2
lines in the pressure-time
waveform show that an The expiratory pressure measured in the expiratory limb of the circuit is lower than
increase in airflow resistance normal because expiratory flow is decreased as the V is being slowly expired through
leads to higher PIP, lower T
expiratory flow, and longer narrowed airways. Expiratory time (T ) is increased as a result. The dashed line depicts
E
expiratory time. inspiratory pressure when airway resistance is relatively normal and the P and PIP
TA
are lower. The circuit expiratory pressure recorded is higher because expiratory flow
rate through the circuit is greater and so is flow-resistive pressure as a result. Since T
E
is longer than normal for obstructive diseases, there is greater potential for volutrauma
Copyright 2013 Cengage Learning. All Rights Reserved. May not be copied, scanned, or duplicated, in whole or in part. Due to electronic rights, some third party content may be suppressed from the eBook and/or eChapter(s).
Editorial review has deemed that any suppressed content does not materially affect the overall learning experience. Cengage Learning reserves the right to remove additional content at any time if subsequent rights restrictions require it.